Download

1 / 36
360 likes | 603 Views
Basis of the BOLD signal. Methods for Dummies 2012-2013 Lila Krishna Lucía Magis-Weinberg. PHYSICS. Overview. Hydrogen atoms have a magnetic moment and spin Hydrogen spins align with B0 (the scanner magnet) with two consequences :

E N D
Basis of the BOLD signal MethodsforDummies 2012-2013 Lila Krishna Lucía Magis-Weinberg
Overview • Hydrogen atoms have a magnetic moment and spin • Hydrogen spins align with B0 (the scanner magnet) with two consequences: • They start precessing with a resonance frequency • A net magnetization vector occurs • RF energy is applied matching the resonance frequency • Spins are flipped over to the transverse plane B1 • RF is turned off • Spins relax back to B0. • This relaxation time is measured (T1 and T2) and used for image contrast
Production of a magneticfield When an electric current flows in a wire that is formed into a loop, a large magnetic field will be formed perpendicular to the loop. When an electron travels along a wire, a magnetic field is produced around the electron. Pooley R A Radiographics 2005;25:1087-1099
Hydrogen proton Magneticmoment SPIN
Alignment of protons with the B0 field. No externalmagneticfield Appliedexternalmagneticfield Spins are randomlyoriented Magneticfields cancel out Spins are alignparallelorantiparallelto B0 Net longitudinal magnetization Spinsstarttoprecess at theirresonancefrequency.
Results from interaction between magnetic fields and spinning How many revolutions in a second does the proton precess? Larmor (precessional) frequency The resonance phenomenon can be used to efficiently transfer electromagnetic energy to the protons to successfully flip them into the transverse plane.
Radiofrequencyenergy • Radiofrequency energy = rapidly changing magnetic and electric fields • For the MR system, this RF energy is transmitted by an RF transmit coil. Typically, the RF is transmitted in a pulse. • This transmitted RF pulse must be at the precessionalfrequency of the protons (calculated via the Larmor equation) in order for resonance to occur and for efficient transfer of energy from the RF coil to the protons.
Absorption of RF Energy • If a spin is absorbs energy from the RF pulse, the net magnetization rotates away from the longitudinal direction to the transverse plane. • The amount of rotation (termed the flip angle) depends on the strength and duration of theRF pulse.
Whenthe RF isswitched off • Spinsreturnfromthetransverseplanetothe longitudinal axis • Spinsstarttodephase • Theseprocesseshappen at thesame time but are measureddifferently.
T1relaxation • A 90° RF pulse rotates the longitudinal magnetization into transverse magnetization. • When the RF is off the magnetization then begins to grow back in the longitudinal direction • The rate at which this longitudinal magnetization grows back is different for protons associated with different tissues and is the source of contrast in T1-weighted images.
T1-weighted contrast Pooley R A Radiographics 2005;25:1087-1099
T2 relaxation • During the RF pulse, the protons begin to precess together (they become “in phase”). • Immediately after the 90° RF pulse, the protons are still in phase but begin to dephase due spin-spin interactions (remember each spin acts as a little magnet) • Transverse magnetization • completely in phase= maximum signal • completely dephased= zero signal • DECAY
all nuclei aligned and precessing in the same direction. nuclei not aligned but still precessing in the same direction. T2 relaxation So MR signal will start off strong but as protons begin to precess out of phase the signal will decay. Source: Mark Cohen’s web slides
T2 relaxation • T2 is the time that it takes for the transverse magnetization to decay to 37% of its original value • Different tissues have different values of T2 and dephase at different rates.
T2* • Protons that experience slightly different magnetic field strengths will precess at slightly different Larmorfrequencies. • T2* = T2 that accounts for spin-spin interactions, magneticfieldinhomogeneities, magneticsusceptibility and chemicalshiftseffects
T2-weighted contrast Pooley R A Radiographics 2005;25:1087-1099
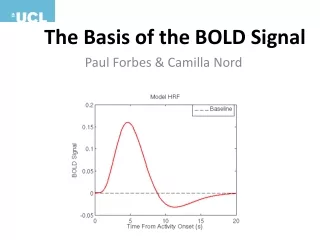
Local Consumption of ATP Neural Activity Local Energy Metabolism CMRO2 CMRGlc CBF CBV From A Physiology POV BOLD signal results from a complicated mixture of these parameters
(Very) General background • Neural activity has metabolicconsequences • Energyisrequiredformaintenance and restoration of neuronal membranepotentials • Energyisnotstored, must be suppliedcontinuoslybythe vascular system (oxygen and glucose)
(Very) General background • Neuronsparticipate in integration and signalling: • Changes in cellmembranepotential • Release of neurotransmitters • Energyrequieredfortherestoration of ionicconcentrationgradients , suppliedviathe vascular system
(Very) General background • A majorconsequence of the vascular response to neuronal activityisthe arterial supply of oxygentaedhemoglobin • Thesechanges in the local concentration of deoxygenatedhemoglobinprovidethebasisforfMRI
Butkeep in mindthat… • Changeswithinthe vascular system in response to neural activitymayoccur in brainareasfarfromthe neuronal activity, initiated in partbyflowcontrollingsubstancesreleasedbyneuronsintotheextracellularspace
Coupling of metabolism and bloodflow • MR signalincreasesduring neuronal activity • More oxygenissuppliedto a brainregionthanisconsumed • As theexcessoxygenatedbloodflowsthroughthe active regions, itflushesthedeoxygenatedhemoglobinthathadbeensuppressingthe MR signal
Thecore of thematter • Oxygenatedhemoglobin • Diamagnetic • has no unpairedelectrons • zeromagneticmoment • Deoxygenatedhemoglobin • Paramagnetic • unpairedelectrons • signifcantmagneticmoment
Consequences of themagneticproperties of Hb Paramagneticsubstancesdistortthesurroundingmagneticfield protonsexperiencedifferentfieldstrengths precess at diffentfrequencies more rapiddecay of transversemagnetization (shorter T2*)
Relationship between neuronal activity and BOLD • The SPM analyses with the separate design matrices (one for each model) showed significant (p < 0.05 (FWE)) correlations between each model and the observed BOLD signal, as can be seen. • The locations of maximal correlation for each model were not far apart and were included in the voxels activated by the experimental task shown in • Although all functions correlated with BOLD, the Heuristic produced higher maximal F-scores and more voxels above the chosen threshold (p < 0.05 (FWE)) than the other two models
Estimating the transfer function from neuronal activity to BOLD using simultaneous EEG-fMRI
Fig. 5 Example regressors for (a) Total Power, (b) Heuristic, and (c) Frequency Response (3 bands) models after convolution with the HRF (subject 2). (d) Example BOLD time series for the same period of time and subject, at the most significant cl... M.J. Rosa , J. Kilner , F. Blankenburg , O. Josephs , W. Penny Estimating the transfer function from neuronal activity to BOLD using simultaneous EEG-fMRI NeuroImage Volume 49, Issue 2 2010 1496 - 1509 http://dx.doi.org/10.1016/j.neuroimage.2009.09.011
Conclusion • Understanding the nature of the link between neuronal activity and BOLD plays a crucial role in improving the interpretability of BOLD imaging and relating electrical and hemodynamic measures of human brain function. Finding the optimal transfer function should also aid the design of more robust and realistic models for the integration of EEG and fMRI, leading to estimates of neuronal activity with higher spatial and temporal resolution, than are currently available.
References • Pooley R A. Fundamental Physics of MR Imaging. Radiographics2005;25:1087-1099 • Noll, D. A primer on MRI and Functional MRI. 2001. • Huettel, S. FunctionalMagneticResonanceImaging. Secondedition. Sinauer, USA, 2008