Download
1 / 28
280 likes | 301 Views
This workshop discusses the data management practices in the US GLOBEC program, focusing on the goal of understanding population dynamics and predicting changes in species distribution and abundance. It covers the history and components of the program, data policy, data sources, data acknowledgement policy, and the use of the JGOFS Data Management System.

E N D
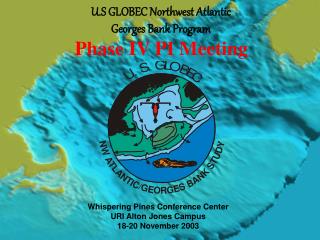
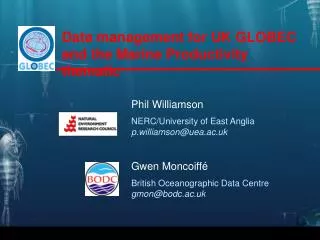
Data Management in the US GLOBEC Program The 2003 National NVODS Workshop Robert C. Groman Woods Hole Oceanographic Institution September 10 – 12, 2003
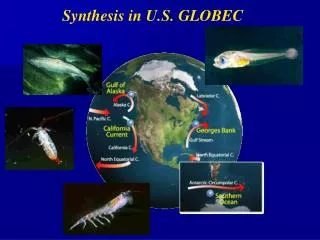
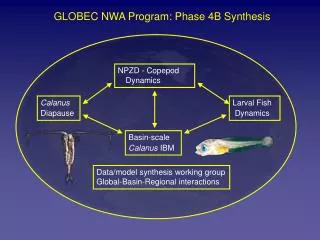
History • US GLOBEC – Global Ocean Ecosystem Dynamics • Goal: understand the population dynamics. Ultimately want to be able to predict changes in distribution and abundance of key species as a result of changes in the physical and biotic environment, such as from climate change.
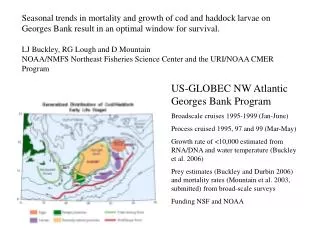
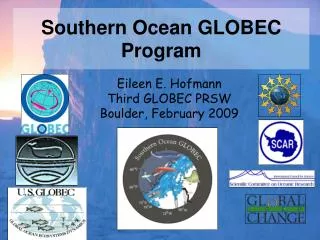
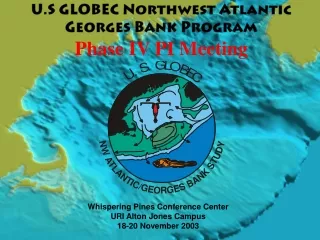
Three US Programs • Georges Bank – field program started in 1995 with some cruises earlier; field program ended in 1999. • Northeast Pacific – field program started in 2000. Gulf of Alaska too. • Southern Ocean – field program started in 2001.
Project Components • Field program: Georges Bank project had 120 cruises with 360 days at sea. • Laboratory experiments • Retrospective analysis • Analysis and synthesis
Data Policy • Dissemination of data to scientific investigators and others on a timely basis • Make available when useful (not necessarily only when finalized) • Serve data and information
Characteristics • Data from many researchers (i.e. distributed; greater than 100 contributors) • Open access – read only by everyone • Restricted access supported • Quality control on-going • Emphasis on access to data and information as early as possible • Data sets most useful when used with other data
Data Acknowledgement Policy • Any person making substantial use of a data set must communicate with the investigators who acquired the data prior to publication and anticipate that the data collectors will be co-authors of published results. This extends to model results and to data organized for retrospective studies. • See on-line policy statement
Data Sources • Broad-scale cruises • Process cruises • Moorings • Drifters • Satellites • Modeling
Instruments • CTDs • Rosette • MOCNESS (3 flavors) • Bongo tows • Acoustic • Video Plankton Recorder • Drifters, MET packages, . . .
Sensors • Conductivity, temperature, pressure, fluorescence, transmittance, acoustics, light (PAR), video, winds speed/direction, AVHRR, . . . • Biomass, taxonomic composition/size distribution, species (counts, size, stage, status, rates, behavior), density, currents, stratification, heat flux, nutrients, turbulence, chlorophyll, . . .
Show Me the Data! • Using the JGOFS Data Management System developed by G. Flierl, J. Bishop, D. Glover, and S. Paranjpe • Distributed access via standard web browsers • Distributed data sources
Web Access • Hierarchical list of data objects • On-line list of data • Downloads as ASCII, Matlab files, or reorganized into single or multiple files • Simple X-Y plots • Interface to EasyKrig and 3-D visualization applications
Distributed Data • Ten distributed servers using the US JGOFS software • Uses the Web’s httpd protocol - integrates very well with standard web pages • Handles tabular data in ASCII, Matlab format, and user-supplied formats using “methods.” It is “object oriented” and “data driven.”
NostalgiaIn the Olden Days …. • Reformatting and processing data was a common activity • Merging navigation with measured and computed results also took time • First data management system used 9 track tapes for data storage, run in batch • Second system used data on disk with techniques to located data within degree squares to improve performance
Meta-data • Data about data. • Document information about data elements or attributes (name, size, data type, etc), about records or data structures (length, fields, columns, etc), and about data (where it is located, ownership, etc.). Meta-data may include descriptive information about the context, quality and condition, or characteristics of the data.
Detailed Meta-data • Pros – required for full understanding of data within a DBMS. Required if others want to use the data • Cons – pain in the neck to prepare, maintain, and enter (Best to take advantage of tools) • Currently completing Global Change Master Directory’s DIF records
What’s Happening • Organizations creating systems to access their own meta-data and/or data. • Umbrella databases linking to other peoples meta-data and/or data. (OBIS, GMBIS, …) • Linking to meta-data is more manageable than is linking to other people’s data.
Other Efforts • LabNet – consortium of marine organizations to make their data available (uses 4D Geobrowser “index cards”) • Ocean Data View - access WOCE, NGDC, and other data sets. CTD, bottle, XBT … • OBIS – “portal” (aggregation server) for biological data (using Darwin Core 2 – OBIS)
Other Efforts, continued • ZOPE – object oriented application server • LAS – web-based, active-image based data interface for registered data. Used by US JGOFS Program • uBio – (Universal Biological Indexer and Organizer) a networked information service for biological information resources based on the Taxonomic Name Server (TNS), a thesaurus; an index.
Other Efforts, continued • Hexacoral – biggest user in OBIS; uses DiGIR (D.G. Fautin, et al.) • DiGIR – Distributed Generic Information Retrieval. Uses XML protocol to get the data. Extends XML to do queries. Uses php software package to execute the code. Supports 14 or 15 databases, e.g SQL based. Three options for JGOFS: export to flat file, export to MySQL, or write own perl script to interface directly to DiGIR (ZooGene -> OBIS)
Other Efforts, continued • Oregon State University, Randy Keller and Paul Johnson, mapping specialist at HMRG • Steve Hankin, “An Implementation Plan for the Data and Communication Subsystem of the U.S. Integrated Ocean Observing System” • Margo Edwards at HIG and Dawn Wright at OSU
Other Efforts, continued • RIDGE, petrological data. Endeavor Observatory website, Lamont’s PetDB • SIO Ocean Exploration data portal, http://sioexplorer.ucsd.edu • University of Washington’s Endeavor GIS and Portal to Endeavor Data (PED)
Educational “Tools” • Virtual Research Vessel, University of Oregon and Oregon State University • REVEL, University of Washington • Dive and Discover, WHOI
Protocols • DODS http; • DiGIR uses XML; but too verbose for physical data. OBIS may use DODS for physical data. • JGOFS http
Other Projects and Protocols • Apologies for references I’ve missed. • There are many other efforts underway in all these areas.
In the Trenches • What temperature: Sea surface, air, at depth? • Units? • How collected? • How calibrated? • Data quality control still labor intensive even though we can collect and store gigabytes of data daily
Future (Local) Efforts • Enhance data search capabilities • Add additional graphical display (visualization) options • Improve interface between data system and visualization/analysis tool • Migrate to NVODS protocol? [Ask Melissa]
Thank You Thanks for the opportunity to listen, learn, and talk.