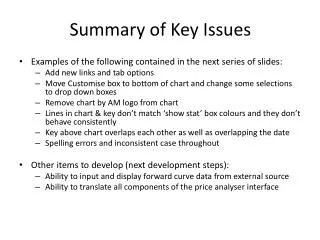
Summary of Key Issues
130 likes | 452 Views
Summary of Key Issues. Examples of the following contained in the next series of slides: Add new links and tab options Move Customise box to bottom of chart and change some selections to drop down boxes Remove chart by AM logo from chart

Summary of Key Issues
E N D
Presentation Transcript
Summary of Key Issues • Examples of the following contained in the next series of slides: • Add new links and tab options • Move Customise box to bottom of chart and change some selections to drop down boxes • Remove chart by AM logo from chart • Lines in chart & key don’t match ‘show stat’ box colours and they don’t behave consistently • Key above chart overlaps each other as well as overlapping the date • Spelling errors and inconsistent case throughout • Other items to develop (next development steps): • Ability to input and display forward curve data from external source • Ability to translate all components of the price analyser interface
Add Week and YTD tabs (like on SBB). Default should open on Week tab. Insert link to specification info (like on SBB) Specification information Capitalise all red circled items and change blue circled items to lower case.
Delete Insert link to old analyser Include an icon that looks more like a calendar – SBB has this, TSI can be the same, or if you have another suggestion
Blue circles lower case, Red circles upper case. Change to ‘Go’ and move up to be underneath ‘Enter end date’ field Change text to: ‘Week beginning DD Mmm YYYY’
Change to drop down list to save vertical space and remove ‘Custom’ option. Default in drop down list should still be ‘Complete range’, with options ‘1 Year’ and ‘Year-to-date’ below this in the list Custom option should be automatically triggered by entering dates in ‘Enter start date’ and ‘Enter end date’ fields and hitting ‘Go’.
Change label to ‘Frequency’ Change to drop down list. Default in drop down list should still be ‘Weekly’. Other options in drop down list should be: Monthly Quarterly Yearly
On the SBB site, the customise box border goes right round the outside of the chart and all other tables, but here it is separate. It would look better if it could go around everything like on SBB Move customise box to below price table
Remove charts by amCharts.com The Boxes below the chart should be coloured to coordinate with the lines in the chart
The HRC N Europe Series refers to the yellow line and the blue box, this is not consistent. Also when you click remove HRC N Europe... The yellow line colour in the chart and the ‘show statistics’ box now refer to a different series (S Europe). When a series is removed, the colours of the lines and boxes that go with the other series should not change, just the line and box of the series removed should disappear.
Please ensure everything is sentence case – i.e. High value, Low value If there is no ‘comparison tip’ it shouldn’t appear. Do you need us to supply content for the comparison tip?
The key at the top of the chart overlaps and makes it too hard to read the last item The link for recalculate statistics falls onto two lines. Change to just “re-calculate” so it falls on one line only
Capitalise all red circled items – keep consistent! This heading to be bolder – and not orange! Should match the heading style for ‘Customise view’ and moved to left of Analyse Remove box border round price table. Customise View border line will now go round all items (like on SBB). When doing another search Analyse was spelled – analize! Please ensure it is consistent! Keep casing consistent – i.e. ‘FLAT’ should be ‘Flat’, ‘LONG’ should be ‘Long’