Download
1 / 44
1.02k likes | 1.98k Views
SQL Server Performance Tuning and Optimization. Plamen Ratchev Tangra, Inc. plamen@tangrainc.com. Lightning McQueen: I'm a precision instrument of speed and aerodynamics. Mater: You hurt your what? . Agenda. Factors affecting performance What is good performance?

E N D
SQL Server Performance Tuning and Optimization Plamen Ratchev Tangra, Inc. plamen@tangrainc.com
Lightning McQueen: I'm a precision instrument of speed and aerodynamics. Mater: You hurt your what?
Agenda • Factors affecting performance • What is good performance? • Application tiers affecting performance • Types of database problems • Writing better queries • Tools • Performance tools in SQL Server 2005 • Profiler • Database Engine Tuning Advisor • Server side traces • DMVs • Troubleshooting performance with DMVs • Focus on specific problems • Cashing problems and recompilation • Parameter sniffing (good or bad) • Methods to handle parameter sniffing • Where to go from here: Resources
What is good performance? (Approaches for managing performance)
Application tiers performance considerations • Performance considerations at other layers: • Connection pooling • Multiple results sets • Caching
Common performance issues • Inefficient queries • Retrieving too much data • Inefficient or missing indexes • Unnecessary round trips • Too many open connections • Failure to release resources • Transaction misuse • Overnormalized tables
Examples of problematic design • One true lookup table • Entity-Attribute-Value (EAV) • Extensive use of functions in WHERE predicates • The “mother” view • All columns defined as NVARCHAR(255) • All columns allow NULLs • Mismatched data types on join columns or filters
SQL Server schema considerations(Provide hints and information to the query engine) • Devote the appropriate resources to schema design • Separate OLAP and OLTP workloads • Normalize first, denormalize for performance later • Define all primary keys and foreign key relationships • Define all unique constraints and check constraints • Choose the most appropriate data type • Use indexed views for denormalization • Partition tables vertically and horizontally.
Database Design Optimization • Do you use DISTINCT or UNION a lot? • Normalization • Denormalization • Horizontal partitioning • Defaults • Primary keys and indexes • Check constraints
Data type optimization • Always specify the narrowest columns you can (especially for JOIN columns) • Minimize use of TEXT, use VARCHAR(MAX) • No need for NVARCHAR and NCHAR if no UNICODE • If data vary use VARCHAR • If data is constant use CHAR • Always use the smallest data type • Specify NULL or NOT NULL for column definition
Query logical processing • FROM: A Cartesian product (cross join) is performed • ON: The ON filter is applied • OUTER: Added non matching rows • WHERE: The WHERE filter is applied • GROUP BY: The rows are grouped based on columns defined • CUBE | ROLLUP: Supergroups (groups of groups) are added • HAVING: The HAVING filter is applied • SELECT: The SELECT list is processed • DISTINCT: Duplicate rows are removed • ORDER BY: The rows are sorted according to the column list specified • TOP: The specified number or percentage of rows is selected
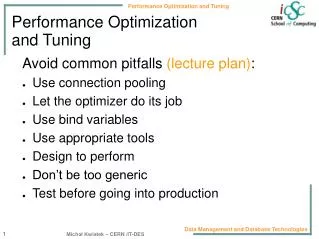
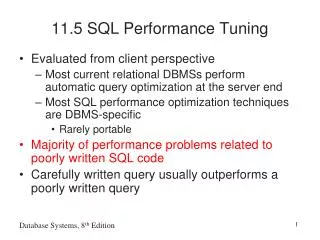
Queries (Tell the SQL Server engine what you want returned, not how to return it!) • Know the performance and scalability characteristics of queries • Write correctly formed queries • Return only the rows and columns needed • Avoid expensive operators such as NOT LIKE • Avoid explicit or implicit functions in WHERE clauses • Use stored procedures or parameterized queries • Avoid long actions in triggers • Use temporary tables and table variables appropriately • Limit query and index hints use • Qualify database objects (object name resolution does take time)
Tips for writing high performance SQL • Avoid using cursors (as well as other looping structures) as much as possible • Filter data wisely • It is usually more efficient to execute multiple statements with one condition than a single statement with multiple OR conditions when executing UPDATE and DELETE • Make wise distinctions between temp tables and table variables • Be careful when joining complex views • Create indexes on temp tables wisely • Avoid execution plan recompilation • Refactoring of old code when moving to new version (example: use of ranking functions in SQL Server 2005 vs. prior version techniques)
T-SQL performance considerations • Always include a WHERE clause in your SELECT statement • When using the UNION statement, keep in mind that, by default, it performs the equivalent of a SELECT DISTINCT • Carefully evaluate whether your SELECT query needs the DISTINCT clause or not • Do not return column data you do not need (and do not use SELECT *) • In a WHERE clause, the various operators used directly affect how fast a query is run • Those operators at the top will produce results faster than those listed at the bottom: • = • >, >=, <, <= • LIKE • <>, NOT LIKE • This lesson here is to use = as much as possible, and <> as least as possible. • Avoid WHERE clauses that are non-sargable (use of functions): • WHERE SUBSTRING(first_name,1,1) = 'm‘ • can be rewritten like this: • WHERE first_name like 'm%'
Create indexes based on use • Keep clustered index keys as small as possible • Consider range data for clustered indexes • Create an index on all foreign keys • Create highly selective indexes • Consider a covering index for often used, high impact queries • Create composite indexes with the most restrictive column first • Use multiple narrow indexes rather than a few wide indexes • Consider indexes on columns used in WHERE, ORDER BY, GROUP BY, and DISTINCT clauses • Remove unused indexes
Optimizing index performance • As a rule of thumb, every table should have at least a clustered index • Indexes should be considered on all columns that are frequently accessed by the WHERE, ORDER BY, GROUP BY, TOP, and DISTINCT clauses • Don’t automatically add indexes on a table because it seems like the right thing to do • Point queries, queries than return a single row, are just as fast using a clustered index as a non-clustered index • Do not over index your OLTP tables, as every index you add increases the time it takes to perform INSERTS, UPDATES, and DELETES • Drop indexes that are never used by the Query Optimizer • Whether an index on a foreign key has either high or low selectivity, an index on a foreign key can be used by the Query Optimizer to perform a merge join on the tables in question • To provide the up-to-date statistics the query optimizer needs to make smart query optimization decisions, you will generally want to leave the "Auto Update Statistics" database option on
Optimizing non-clustered indexes • Non-clustered indexes are best for queries: • That return few rows (including just one row) and where the index has good selectivity (generally above 95%) • That retrieve small ranges of data. Clustered indexes perform better for large range queries • Where both the WHERE clause and the ORDER BY clause are both specified for the same column in a query. This way it helps to speed up accessing the records, and it also speeds up the sorting of the records • That use JOINs (although clustered indexes are better) • When the column or columns to be indexed are very wide. While wide indexes are not a good thing, if you there is no choice a non-clustered index will have overall less overhead than a clustered index on a wide index • If a column in a table is not at least 95% unique most likely the query optimizer will not use it.
Performance tools • SQL Profiler • Database Engine Tuning Advisor
Isolating long running queries with SQL Profiler • To identify a long-running query interactively • 1. Start SQL Profiler. • 2. On the File menu, click New, and then click Trace. • 3. Specify the relevant connection details to connect to the computer running SQL Server. • The TraceProperties dialog box appears. • 4. In the Template name list, click SQLProfilerTSQL_Duration. • 5. Click the Events tab. • Notice that two key events are selected: • RPC:Completed from the Stored Procedures event class • SQL:BatchCompleted from the T-SQL event class • 6. Click Run to run the trace. • 7. Start SSMS and open a Query. • 8. Run the queries you want to analyze. • 9. View the trace output in SQL Profiler. Note that durations are given in milliseconds. • 10. Stop the trace.
SQL Profiler Data • Events: • Stored procedures: RPC Completed • TSQL: BatchCompleted • Data Columns: • TextData • Duration • CPU • Reads • Writes • DatabaseName and ApplicationName • EndTime • SPID • Filters: • Duration >= 10 ms. Unless you want to save a workload file for replay, you are not interested in queries that take less than 10 ms.
Query Execution plan analysis • Table Scan: If you see this message, it means there was no clustered index on the table and that no index was used to look up the results. Literally, each row in the table being queried had to be examined. If a table is relatively small, table scans can be very fast, sometimes faster than using an index. • Index Seek: When you see this, it means that the query optimizer used a non-clustered index on the table to look up the results. Performance is generally very quick, especially when few rows are returned. • Clustered Index Seek: If you see this, this means that the query optimizer was able to use a clustered index on the table to look up the results, and performance is very quick. In fact, this is the fastest type of index lookup SQL Server can do. • Clustered Index Scan: A clustered index scan is like a table scan, except that it is done on a table that has a clustered index. Like a regular table scan, a clustered index scan may indicate a performance problem. Generally, they occur for two different reasons. First, there may be too many rows to retrieve, relative to the total number of rows in the table. See the "Estimated Row Count" to verify this. Second, it may be due to the column queried in the WHERE clause may not be selective enough.
Query Execution plan analysis - warnings • Index or table scans: May indicate a need for better or additional indexes. • Bookmark Lookups: Consider changing the current clustered index, consider using a covering index, limit the number of columns in the SELECT statement. • Filter: Remove any functions in the WHERE clause, don't include Views in your Transact-SQL code, may need additional indexes. • Sort: Does the data really need to be sorted? Can an index be used to avoid sorting? Can sorting be done at the client more efficiently?
Server side traces • The correct way to run traces in production environment • Use sp_trace_create to create a trace • Use sp_trace_setevent to set events to track • Use sp_trace_setfilter to set filters • Use sp_trace_setstatus to start and stop a trace • sp_trace_setstatus trace_id, 1 (start trace) • sp_trace_setstatus trace_id, 0 (stop trace) • sp_trace_setstatus trace_id, 2 (close trace and remove definition from server) • Read traces with fn_trace_gettable
Database Engine Tuning Advisor • You can control how much time the Database Engine Tuning Advisor spends analyzing a workload. The quality of the recommendations improves as the amount of time increases. • You can include workloads with: User-defined functions, batches that reference temporary tables, statements in triggers. • Tune across multiple databases: You can tune a workload that involves multiple databases. • Tuning log: Database Engine Tuning Advisor writes to the tuning log all events that it cannot tune and provides a message that gives a reason why the event could not be tuned. You can view the log during the tuning session to determine whether Database Engine Tuning Advisor can tune the events in your workload. • What-if analysis: The Database Engine Tuning Advisor user-specified configuration feature supports what-if analysis. The user-specified feature allows you to specify a configuration of existing and hypothetical physical design structures in an XML input file. Then you can use Database Engine Tuning Advisor to evaluate the effects of these physical design structures without incurring the overhead of implementing the configuration before you begin tuning. • More control over tuning options: Database Engine Tuning Advisor allows you to specify a greater variety of tuning options. For example, you can specify that Database Engine Tuning Advisor consider adding non-clustered indexes or keep all existing clustered indexes when it generates a recommendation. • XML support: Database Engine Tuning Advisor can take an XML file as input or generate recommendations in XML.
Database Engine Tuning Advisor – more tuning features • Partitioning recommendations: Database Engine Tuning Advisor can also recommend partitioning when appropriate to improve performance and manageability of large tables. • Supports using a test server to reduce the production server tuning load: Database Engine Tuning Advisor tunes a database on a production server by offloading most of the tuning load onto a test server. It does this by using the production server hardware configuration information and without actually copying the data from the production server to the test server. Database Engine Tuning Advisor does not copy actual data from the production server to the test server. Instead, it only copies the metadata and necessary statistics. • In addition to members of the sysadmin fixed server role, members of the db_owners fixed database role can use Database Engine Tuning Advisor to tune databases that they own.
Optimizing Indexes • Use SQL Profiler to capture data • Use the Database Engine Tuning Advisor to select the correct indexes to build • Check Execution Plans to confirm the effect of recommendations • Update statistics and defragment the indexes
Dynamic Management Views and Functions • There are two different kinds of DMVs and DMFs: • Server-scoped: These look at the state of an entire SQL Server instance • Database-scoped: These look at the state of a specific database • Example – select system waits: SELECT wait_type, wait_time_ms, wait_time_ms / 1000. AS wait_time_s FROMsys.dm_os_wait_stats WHERE wait_type NOTLIKE'%SLEEP%';
Classes of DMVs and DMFs • Common Language Runtime Related Dynamic Management Views • I/O Related Dynamic Management Views and Functions • Database Mirroring Related Dynamic Management Views • Query Notifications Related Dynamic Management Views • Database Related Dynamic Management Views • Replication Related Dynamic Management Views • Execution Related Dynamic Management Views and Functions • Service Broker Related Dynamic Management Views • Full-Text Search Related Dynamic Management Views • SQL Server Operating System Related Dynamic Management Views • Index Related Dynamic Management Views and Functions • Transaction Related Dynamic Management Views and Functions
A few performance tuning related DMVs and DMFs • sys.dm_exec_query_stats (aggregate performance statistics for cached query plans) • sys.dm_exec_sql_text (text of the SQL batch that is identified by the specified sql_handle) • sys.dm_os_wait_stats (waits encountered by threads that are in execution) • sys.dm_os_workers (every worker in the system) • sys.dm_os_schedulers (schedulers mapped to processors) • sys.dm_os_memory_clerks (memory clerks that are currently active) • sys.dm_db_missing_index_details (information about missing indexes) • sys.dm_tran_locks (active request for locks that has been granted or waiting to be granted) • sys.dm_exec_cached_plans (cached query plans, cached query text, amount of memory taken by cached plans, and reuse count of the cached plans)
DMV Examples(Top waits) SELECTTOP(10) wait_type, wait_time_ms / 1000. AS wait_time_s, 100. * wait_time_ms /SUM(wait_time_ms)OVER()AS pct FROMsys.dm_os_wait_stats WHERE wait_type NOTLIKE'%SLEEP%' ORDERBY wait_time_s DESC;
DMV Examples(Worker time – top CPU usage queries; identify inefficient query plan) SELECTTOP(10) total_worker_time/execution_count AS avg_cpu_cost, execution_count, query_text FROMsys.dm_exec_query_statsAS Q CROSSAPPLY(SELECTSUBSTRING(text, statement_start_offset/2 + 1, (CASEWHEN statement_end_offset =-1 THENLEN(CONVERT(NVARCHAR(MAX),text))* 2 ELSE statement_end_offset END- statement_start_offset)/ 2) FROM sys.dm_exec_sql_text(sql_handle))AS S(query_text) ORDERBY [avg_cpu_cost] DESC;
DMV Examples(CPU pressure) SELECTCOUNT(*)AS workers_waiting_for_cpu, S.scheduler_id FROMsys.dm_os_workersAS W JOINsys.dm_os_schedulersAS S ON W.scheduler_address = S.scheduler_address WHERE W.state ='RUNNABLE' AND S.scheduler_id < 255 GROUPBY S.scheduler_id; • State: • RUNNING – currently executing on the CPU • RUNNABLE – waiting for its turn on the CPU • SUSPENDED – waiting on resource (lock, I/O, etc.)
DMV Examples(Top recompiled queries/batches) SELECTTOP(10) plan_generation_num, execution_count, query_text FROMsys.dm_exec_query_stats CROSSAPPLY(SELECTSUBSTRING(text, statement_start_offset/2 + 1, (CASEWHEN statement_end_offset =-1 THENLEN(CONVERT(NVARCHAR(MAX),text))* 2 ELSE statement_end_offset END- statement_start_offset)/2) FROM sys.dm_exec_sql_text(sql_handle))AS S(query_text) WHERE plan_generation_num > 1 ORDERBY plan_generation_num DESC;
DMV Examples(Identify internal components that are stealing the most pages from buffer pool) SELECTTOP(10) type, SUM(single_pages_kb)AS stolen_mem_kb FROMsys.dm_os_memory_clerks GROUPBYtype ORDERBYSUM(single_pages_kb)DESC;
DMV Examples(Top queries/batches generating the most I/Os) SELECTTOP(10) (total_logical_reads/execution_count)AS avg_logical_reads, (total_logical_writes/execution_count)AS avg_logical_writes, (total_physical_reads/execution_count)AS avg_phys_reads, execution_count, plan_handle, query_text FROMsys.dm_exec_query_statsAS Q CROSSAPPLY(SELECTSUBSTRING(text, statement_start_offset/2 + 1, (CASEWHEN statement_end_offset =-1 THENLEN(CONVERT(NVARCHAR(MAX),text))* 2 ELSE statement_end_offset END- statement_start_offset)/ 2) FROM sys.dm_exec_sql_text(Q.sql_handle))AS S(query_text) ORDERBY(total_logical_reads + total_logical_writes)DESC;
DMV Examples(Identify missing indexes and their usefulness) SELECT D.object_id, S.user_seeks, S.user_scans, D.equality_columns, D.inequality_columns FROMsys.dm_db_missing_index_detailsAS D JOINsys.dm_db_missing_index_groupsAS G ON D.index_handle = G.index_handle JOINsys.dm_db_missing_index_group_statsAS S ON G.index_group_handle = group_handle WHERE database_id =DB_ID() ANDobject_id=OBJECT_ID('Customers');
DMV Examples(Locks that have been granted or waited - sp_lock) SELECT request_session_id AS spid, resource_type, resource_database_id AS db, (CASE resource_type WHEN'OBJECT' THENobject_name(resource_associated_entity_id) WHEN'DATABASE' THEN' ' ELSE(SELECTobject_name(object_id) FROMsys.partitions WHERE hobt_id = resource_associated_entity_id) END)AS objname, resource_description, request_mode, request_status FROMsys.dm_tran_locks;
Performance tuning method • Analyze waits at the instance level • Correlate waits with queues • Determine a course of action • Drill down to the database level • Drill down to the process level • Tune indexes/queries
Focus on specific problems(Caching and recompilation) • When recompilation is good: • The schema of a table referenced by the query has changed • Statistics of a table referenced by the query have changed • The batch has changed with plan affecting options like CONCAT_NULL_YIELDS_NULL or ANSI_NULLS • Use parameterization for optimum plan reuse • Look to achieve Prepared plan rather than Adhoc
Focus on specific problems(Parameter sniffing) What is “parameter sniffing”? When a stored procedure is first executed SQL Server looks at the input parameters and uses this as guidance to build the query plan. This is known as "parameter sniffing". This is good as long as the input parameters for the first invocation are typical for future invocations. But if that is not the case this will cause performance problems. For example, a procedure is supposed to retrieve all rows for customer orders with non-clustered index on the customer column. If the first invocation returns a large ser of orders it may be most efficient to scan the table. Further invocations may be for a single order, but the first cached plan with table scan will be used resulting in poor performance.
Focus on specific problems(Parameter sniffing solutions) • Solutions • Replacing parameters with local variables (SQL Server does not sniff local variables, yet) • Use OPTION (RECOMPILE) in the query • Use WITH RECOMPILE when executing the stored procedure • Use OPTION (OPTIMIZE FOR) in the query • Use Plan Guide
New in SQL Server 2008 • Enhanced parallel query processing on partitioned objects • FORCESEEK query hint • Optimized bitmap filtering (star schema query optimization) • Sparse columns • Filtered indexes
Where to go from here: Resources Books: Inside SQL Server 2005: Query Tuning and Optimization (Kalen Delaney) SQL Tuning (Dan Tow) SQL Server Query Performance Tuning Distilled (Sajam Dam) SQL Server 2005 Practical Troubleshooting (Ken Henderson) Inside SQL Server 2005: T-SQL Querying (Itzik Ben-Gan) Links (white papers, blogs, utilities): Batch Compilation, Recompilation, and Plan Caching Issues in SQL Server 2005 http://www.microsoft.com/technet/prodtechnol/sql/2005/recomp.mspx Statistics Used by the Query Optimizer in Microsoft SQL Server 2005 http://www.microsoft.com/technet/prodtechnol/sql/2005/qrystats.mspx Tips, Tricks, and Advice from the SQL Server Query Processing Team http://blogs.msdn.com/sqlqueryprocessing/ Troubleshooting Performance Problems in SQL Server 2005 http://www.microsoft.com/technet/prodtechnol/sql/2005/tsprfprb.mspx Script Repository: SQL Server 2005 http://www.microsoft.com/technet/scriptcenter/scripts/sql/sql2005/default.mspx?mfr=true SQL Server websites: http://www.sql-server-performance.com http://www.sqlservercentral.com http://www.sqlcommunity.com
Okay, here we go. Focus. Speed. I am speed. One winner, forty-two losers. I eat losers for breakfast. Breakfast? Maybe I should have had breakfast? Brekkie could be good for me. No, no, no, focus. Speed. Faster than fast, quicker than quick. I am Lightning.