Remote Sensing Comparison of LAI and PAR in Qazvin Plain, Iran
Study evaluates remotely sensed LAI and PAR with ground measurements in Qazvin Plain, Iran, highlighting the importance of canopy variables in environmental modeling. Different methods and validation techniques are discussed, showing the necessity of calibration with ground data.

Remote Sensing Comparison of LAI and PAR in Qazvin Plain, Iran
E N D
Presentation Transcript
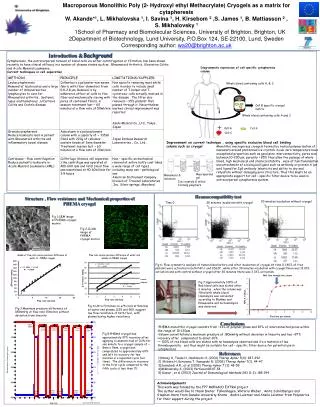
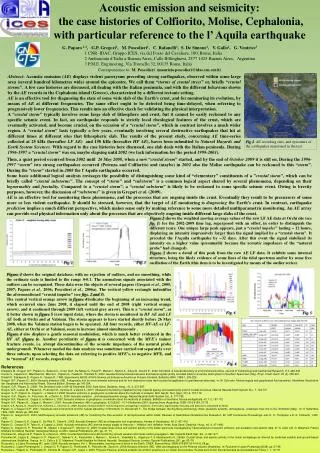
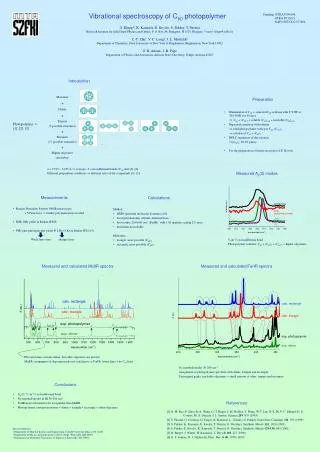
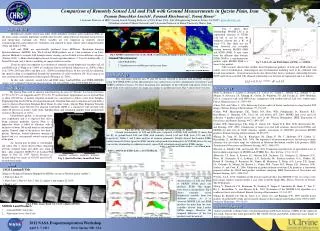
Comparison of Remotely Sensed LAI and PAR with Ground Measurements in Qazvin Plain, IranPeyman Daneshkar Arasteh1, Faranak Khoshnavaz2, Tooraj Honar3 1 Assistant Professor of IKIU, Qazvin, Iran & Visiting Professor of UCI, Irvine, USA , E4130 Engineering Gateway, Irvine, CA 92697, pdaneshk@uci.edu 2 Graduate student of Shiraz University and 3 Assistant Professor of Shiraz University, Shiraz, Iran Introduction Fig. 7 shows these relationships. MODIS LAI is an exponential function of ETM+ LAI and as can be seen the nonlinear relation has a R2 of about %70. But, there was not been observed any resonable relation between MODIS fPAR and ETM+ fPAR. It may come from the different time domain. ETM+ fPAR is a simultantaneous product while MODIS fPAR is a mean 8-day product. Biophysical variables of leaf area index (LAI) and photo-synthesis active radiation (PAR) are the main canopy structure dependant variables that describe canopy physical-structural characteristics and energy-mass exchange rate. These variables are very important in remotely sensed evapotranspiration and productivity estimations and required in many climate and ecological models (Chen and Cihler, 1996). LAI and fPAR are operationally produced from MODerate Resolution Imaging Spectroradiometer (MODIS) data. The LAI and fPAR products are at 1-km resolution at an 8-day interval. Methods to estimate LAI through remote sensing can be divided in four different categories (Urrutia, 2010): 1- Make relationship between LAI and vegetation indices; 2- Use of a lookup table; 3- Neural Network; and 4- Inverse modeling of canopy radiative transfer. There are many investigation on evaluation of remotely sensed biophysical variables of LAI and fPAR such as Wang et al. (2004) in Coniferous forests of Finland; Morisette et al. (2006); Cohen et al. (1996, 2003 and 2006); and Brut et al., (2009) in southern France. In the case of LAI validation, the spatial scaling is accomplished through the generation of a fine-resolution (20–30 m) map of an area covering several moderate-resolution pixels (Huang et al., 2006). In this study remotely sensed LAI and PAR using Landsat/ETM+ and TERRA/MODIS images were compared with ground measurements of LAI and PAR using ACCUPAR/LP80 device. Fig 3. MODIS vegetation cover (Left), fPAR (Center) and LAI (Right) 1-km 8-day products 06/03/10 . Ground Measurement • ACCUPAR LP80, • 2. Simultaneous to satellite pass in the same dates Fig 7. LAI (Left) and fPAR (Right) of ETM+ v.s. MODIS. This research showed that satellite based biophysical products of LAI and fPAR which are widely used in hydrological, climatological and environmental modeling need to be calibrated with ground measurements. Ground measurements also showed that there is nonlinear relationship between NDVI and LAI in corn filed. The obtained relationship is in the form of exponential and is as follows: Fig 4. ACCUPAR device Methodology Two corn farms with the area 55 and 125 ha was selected to measure LAI and PAR variables using ACCUPAR-LP80 system. Measurements was carried on in six dates simultaneous to Landsat 7 and TERRA satellites over pass. To select measuring sites uniformity of the cultivated crop and its extent was noted while to be representative of a large area similar to satellite pixel size. Figs 5 shows these two sites. LAI = 0.531e5.315NDVI , R2 = 0.95 Study Area References The Qazvin Plain with its adjacent watersheds has an area of 9,300 km2. It is located between 49o 25' to 50o 35' east longitude and 35o 25' to 36o 25' north latitude. Approximate area of Qazvin Plain is about 450,000 ha. A modern irrigation network was constructed to deliver water from Taleghan Regulating Dam for 60,000 ha of irrigated farm lands. Taleghan Dam and its irrigation network deliver water to Qazvin Plain from Taleghan River Basin. In other words, Qazvin Plain Irrigation Network (QPIN) transfers water between two adjacent watersheds. QPIN is a conjunctive type network with about 28 percent of surface water from Taleghan Dam and remaining supplies from groundwater resources (Kaviani et al., 2011). Brut, A., Rudiger, C., Lafont, S., Roujean, J.L., Calvet, J.C., Jarlan, L., Gibelin, A.L., Albegel, C., Le Moigne, P., Soussana, J.F., Klumpp, K., Guyon, D., Wigneron, J.P., and Ceschia, E., 2009, Modeling LAI at a regional scale with ISBA-A-gs: comparison with satellite-derived LAI over southweatern France, Biogeosciences, 6: 1389-1404. Chen, J.M., and Cihler, J., 1996, Retrieving leaf area index of boreal conifer forests using Landsat TM images, Remote Sening of Environment, 55: 153-162. Cohen, W.B., Maiersperger, T.K., Turner, D.P., Ritts, W.D., Pflugmacher, D., Kennedy, R.E., Kirschbaum, A., Running, S.W., Costa, M., and Gower, SiT., 2006, MODIS land cover and LAI collection 4 product quality across nine sites in the Western Hemisphere, IEEE Transaction of Geoscience and Remote Sensing, 44(7): 1843-1857. Cohen, W.B., Maiersperger, T.K., Yang, Z., Gower, S.T., Turner, D.P., Ritts, W.D., Berterretche, M., and Running, S.W., 2003, Comparisons of land cover and LAI estimates derived from ETM+ and MODIS for four sites in North America: aquality assessment of 2000/2001 provisional MODIS products, Remote Sensing of Environment, 88:233-255). Huang, D., Yang, W., Tan, B., Rautiainen, M., Zhang, P., Hu, J., Shabanov, N.V., Linder, S., Knyazikhin, Y., and Myneni, R.B., 2006, The importance of measurement errors for deriving accurate reference leaf area index maps for validation of Moderate Resolution satellite LAI products, IEEE Transaction of Geoscience and Remote Sensing, 44(7): 1866-1871. Kaviani, A., Sohrabi, T.M., and Arasteh, P.D., 2011, Estimation of productivity of agricultural water in Qazvin plain using images of MODIS and AVHRR, Eco., Env. & Cons., 17(1): 11-19. Morisette, J.T., Baret, F., Privette, J.L., Myneni, R.B., Nickeson, J.E., Garrigues, S., Shabanov, N.V., Weiss, M., Fernandes, R.A., Leblance, S.G., Kalacska, M., Sanchez-Azofeifa, G.A., Chubey, M., Rivard, B., Stenberg, P., Rautianen, M., Viopio, M., Manninen, T., Pilant, A.N., Lewis, T.E., Iiames, J.S., Colombo, R., Meroni, M., Busetto, L., Cohen, W.B., Turner, D.P., Warner, E.D., Petersen, G.W., Seufert, G., and Cook, R., 2006, Validation of global moderate resolution LAI products: a framework proposed within the CEOS land product validation subgroup, IEEE Transaction of Geoscience and Remote Sensing, 44(7): 1804-1817. Urrutia, J.A.S., 2010, Validation of the leaf area index product from MODIS-15 for rice using a soil-leaf-canopy radiative transfer model: a case study in Seville Spain, MSc. Thesis, Univerity of Twente, The Netherlands. Wang, Y., Woodcock, C.E., Beurmann, W., Stenberg, P., Voipio, P., Smolander, H., Hame, T., Tian, Y., Hu, J., Knyazikhin, Y., and Myneni, R.B., 2004, Evaluation of the MODIS LAI algorithm at a coniferous forest site in Finland, Remote Sensing of Environment, 91: 114-127. Zhang, K., Kimball, J.S., Mu, Q., Jones, L.A., Goetz, S.J., and Running, S.W., 2009, Satellite based analysis of northern ET trends and associated changes in the regional water balance from 1983 to 2005, Journal of Hydrology, 379: 92-110 Groundwater quality is decreasing from over exploitation and it is expected that soil is being salinized gradually. Qazvin Plain is a depression which is filled by alluvium with a thickness of about 200 m and forms an unconfined aquifer. General slope of the plain is less than 1 percent. Therefore, natural subsurface drainage is limited and it is concentrated toward eastern part of the plain. So, eastern part of plain is waterlogged and saline. Fig. 1, shows Qazvin Plain, irrigation network, irrigated farms and saline area using a false color composite RGB=752 of Landsat/TM image of June 28, 1987. Qazvin Province is located within two scenes of 165-035 and 166-035 of mentioned image. Fig 5. The 55 ha Corn field (Left) and the 125 ha measuring site (Right). Ground measurements of LAI and PAR were compared to ETM+ LAI and PAR. It shows that the R2 of ground-based LAI and PAR with remotely sensed LAI and PAR were 0.56 and 0.89, respectively. Tables 1 and 2 show analysis of variance summaries. Results showed that Landsat ETM+ underestimated LAI but agreed in fPAR variable with ground data obtained by ACCUPAR device. So, one can use this relationship to calibrate remotely sensed LAI calculated using Landsat ETM+ images. Table 2. ANOVA for ETM+ PAR v.s. ACCUPAR PAR Table 1. ANOVA for ETM+ LAI v.s. ACCUPAR LAI Fig 1. Qazvin Province in north of Iran. Data USGS Landsat/ETM+ Images of Enhanced Thematic Mapper Plus(ETM+) sensors of NASA Landsat satellite 7: 1. Path 165, Row 35 2. Dates June 3, June 19, July 5, July 21, August 6 and August 22, 2010 3. Band 1 to 7 To relate ground measurements of LAI and fPAR to MODIS 1000m pixel size products, ETM+ 30m images were used as intermediator. Fig 6 shows remotely sensed biophysical variables from two different sources. As it is observed MODIS LAI and fPAR products are more than the same variables derived from Landsat ETM+ images. However, the temporal difference of the two products must be noticed. Fig 2. ETM+ images Band 1 to 7 (Left to Right) 06/03/10. MODIS Land Products • LAI and fPAR 1-km 8-day • Vegetation Cover 1-km 8-day Acknowledgment Author would like to thank Center of hydroclimatology and Remote Sensing (CHRS) for the support of this study. Data of this study provided by IRI, USGS, NOAA and NASA. Author has many thanks to these organisations. Fig 6. LAI (Left) and fPAR (Right) maps of ETM+ and MODIS 2011 NASA Evapotranspiration Workshop April 5- 7, 2011 Silver Spring, MD, USA