Download
1 / 19
190 likes | 241 Views
Learn about fish classification tools in the context of water monitoring under the Water Framework Directive (WFD). Understand the importance, use, pros, and cons of these tools for assessing fish species composition and abundance. Explore how fish barriers impact fish classification and regulation.

E N D
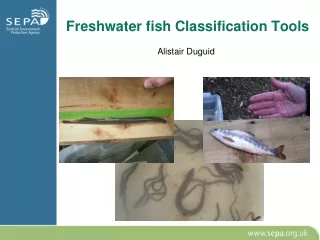
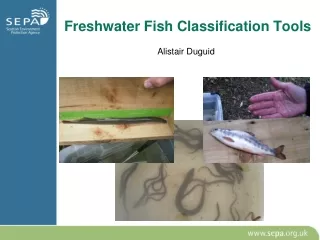
Alistair Duguid Freshwater Fish Classification Tools
WFD fish monitoring • WFD is underpinned by monitoring • including “species composition, abundance and age structure of fish” • Pro’s • High in food chain- ultimate receptors of pressures • Can be good indicators of certain specific issues • Charismatic, high social and economic importance • Con’s • Difficult to predict pressure/response relationship • Difficult and expensive to monitor • Migratory component for some species • Stocking and translocation
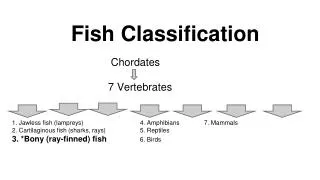
Fish classification • Fish are an important part of WFD classification • Cause of many of the WFD waterbody downgrades, and subsequent measures. • Fish classification derived from 2 tools- • Fish ecology tool, based on analysis of electrofishing data • Fish barrier tool, based on GIS analysis of barrier data.
Fish ecology tool: FCS2 • Basic approach similar to Ireland, and England/Wales • Uses Bayesian-based modelling of variables (environmental, spatial and pressure) to predict: • Prevalence (the probability that a species is present) and average abundance of each species at each site. • Total observed count then compared to expectations at that site,under reference conditions • Models expected distribution using a Zero-inflated negative binomial distribution
Prevalent and abundant
FCS2 input data • Scottish model can use one-run or multiple pass electrofishing data • SFCC-standard data is ideal. • Future data from MSS national project will also be suitable. • Based on salmonids only (disturbance sensitive and data widely available) • Covariates initially chosen on the basis of expected importance • e.g. distance to sea, geology, presence of barriers, spatial location, NH4, P • Significant variables used to fit final regression model with MCMC
Pressure variables • FCS2 uses pressure variables • Environmental covariates which are likely to be caused by anthropogenic pressure • Chosen based on expert opinion • Set reference values for these from national or EU guidelines (e.g. REFCOND) • Add these into the calibration model to predict fish abundance at reference condition at each site
EQR calculation • EQR= “ecological quality ratio” • Value from 0= lifeless, to 1= pristine • For FCS2 calculated from probability of catching the observed number (or fewer) fish, at the specific site, under reference conditions • FCS2 provides EQRs at several different levels: • for each species in a survey • joint EQRs across surveys at a single site • combined EQRs from several sites in a waterbody
Setting class boundaries • Involves using artificial datasets to assess the EQR’s for catches which match ideal class conditions (taken from WFD normative definitions) • Then choose the boundary values which give maximum separation between these
Classification and regulation of fish barriersAlistair DuguidFishery Trust Workshops June 2018
SEPA has included fish barriers directly in WFD classification since 2008 • Allows fish pressures to be captured without necessarily having electrofishing data • Important in identifying fish- specific pressures in 1st RBMP • Aims to identify and account for the most important and clear cut issues • Major cause of waterbody downgrades • Key priority for restoration • “One-out-all-out” principle of classification • A “passing” fish barrier result doesn’t over-ride other downgrades e.g. from electrofishing Background Photos: Colin Bull, Stirling University
Fish barrier classification • Classification standards developed by UKTAG • Interpreted for Scotland in the SG Classification Directions • These define “Severe loss” as being “more than 80 % of fish that would otherwise be able to move upstream to, or downstream from, the river or part concerned”. • Changes between 1st and 2nd RBMP • Incorporating standardised barrier assessment criteria (WFD111) into “80% rule” • Specific inclusion of all migratory species- 80% apply to any one species, although suggest electrofishing evidence also necessary for eels and lamprey • Minor changes to use river length rather than catchment area
Barrier classification- key points • SEPA currently hold information on ~ 3700 barriers • ~1330 imp waterfalls • ~1760 artificial passable barriers • ~580 artificial impassable barriers • Data from a mixture of sources • New records are sense checked by SEPA fish ecologists • Older records have not been re-assessed unless SEPA have received data suggesting original assessment wrong • SEPA have prioritised new surveys : • To find natural limits to migration above key impassable weirs • In areas where waterfalls and weirs marked on OS maps • In urban areas where barriers are likely
Fish barriers as pressures • For River Basin Planning, impacts (i.e. results of less than good status) require an explanatory pressure • The pressure is then used to set objectives for action • Barriers can be used to explain failing fish ecology results upstream • Both impassable or passable barriers can be considered if supported by evidence • Examples might include: • Inadequate fish passes on large hydro dams • Cumulative impacts of several passable but difficult weirs • Process requires fish ecology classification as starting point • Electrofishing, possibly adults in future?
Fish barriers as pressures • Assigning pressures based on weight of evidence • Requires confidence in the impact and the link to pressure • Type of information considered • Evidence of impact • How many sites assessed? • Which species affected? • What classification result? • What level of change compared to downstream population? • Impact on adult or smolt numbers? • Type of barrier • Likely severity to different species • E.g. Key dimensions, WFD111 assessment • Existing mitigation measures • Conformance with good practice guidelines • Possible alternative explanations