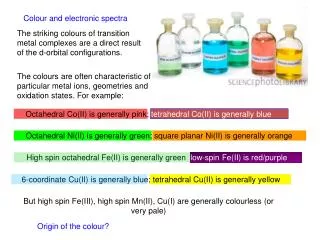
Colour and electronic spectra
Octahedral Co(II) is generally pink; tetrahedral Co(II) is generally blue. Octahedral Ni(II) is generally green; square planar Ni(II) is generally orange. Colour and electronic spectra. The striking colours of transition metal complexes are a direct result of the d-orbital configurations. .

Colour and electronic spectra
E N D
Presentation Transcript
Octahedral Co(II) is generally pink; tetrahedral Co(II) is generally blue Octahedral Ni(II) is generally green; square planar Ni(II) is generally orange Colour and electronic spectra The striking colours of transition metal complexes are a direct result of the d-orbital configurations. The colours are often characteristic of particular metal ions, geometries and oxidation states. For example: High spin octahedral Fe(II) is generally green; low-spin Fe(II) is red/purple 6-coordinate Cu(II) is generally blue; tetrahedral Cu(II) is generally yellow But high spin Fe(III), high spin Mn(II), Cu(I) are generally colourless (or very pale) Origin of the colour?
Ground state Excited state hn Do Do eg1,2Eg t2g1,2Tg hc = Eex – Egs = Do hn = l • Where: h = Planck’s constant, l = wavelength of radiation, c = speed of light • = frequency of radiation, Eex = energy of the excited state Egs = energy of the ground state, Do = crystal field splitting parameter Consider the simple octahedral complex [Ti(H2O)6]3+. This is a d1 ion with a t2g1 configuration in the ground state: The electron absorbs a photon of energy hnand is raised from the t2g orbitals to the eg set. This is called a d-d transition. Energy required for the transition can be written as:
Ground state Excited state hn Do Do eg1,2Eg t2g1,2Tg [Ti(H2O)6]3+ absorbs in the green part of the visible spectrum, so a solution of the complex appears purple. For most first transition series complexes, the absorbed energy lies in the visible region (400-800 nm) - so the complexes appear coloured. For second and third transition series complexes, D is larger – the transitions are often in the uv, so the complexes are not coloured. Note: the excited state is not stable, the electron will quickly return to the ground state.
l lmax io i absorbance detector source solution of complex in glass or quartz cell 500 nm 20,000 cm-1 l(nm) cm-1 Measurement of the visiblespectrum: A solution of the complex (conc c) is placed in a quartz or glass cell Irradiated with visible light, energy is absorbed to excite d-d transitions Detector records the absorbance across the visible spectrum. [Ti(H2O)6]3+ shows one absorption band at ~500 nm (or 20,000 cm-1). The energy of the absorption gives a direct measure of D (in this simple case): Do ≈ 20,000 cm-1 ≈ 240 kJ mol-1 The intensity of the absorption is measured in terms of the molar extinction coeff. e (absorptivity), according to Beer’s Law: Abs = ecl (l mol-1 cm-1) Note: theintensity of the band has nothing to do with its energy.
lX [Ti(X)6]3+ [Ti(H2O)6]3+ lwater absorbance DX Dwater l(nm) cm-1 [Ti(H2O)6]3+ system again. The energy of the absorption gives a measure of Dwater What if the water molecules are exchanged for some other ligand X, which causes a larger crystal field splitting DX? The electronic spectrum of the new complex, [Ti(X)6]3+, will still consist of a single band - If DXis larger than Dwater,the band appears at higher energy. Note: Higher energy is shorter wavelength or higher wavenumber Note: Electronic spectrum–due to electron transitions of any kind. d-d spectra are one particular kind of electronic spectra.
Spectrochemical series for common ligands: Weak field ligands – small D I− < Br−< SCN− ~ Cl− < NO3− < F− ~ OH− < ONO− < HCOO− < H2O < NCS− < edta < py ~ NH3 < en < phen < NO2− < CN− < CO Strong field ligands – large D Values of D can be determined from d-d spectra and depend on the ligand. Spectrochemical series - ligands arranged in an experimentally determined order of “ligand field splitting power” (increasing D). The series generally reflects the strength of the metal-ligandinteraction. Notes: 1) The series is a generalisation – there are exceptions. 2) Although OH– is an ion, it is a weaker ligand than H2O. 3) CN– is a much stronger ligand than OH–, although the ions are apparently rather similar. Why? – these cannot be explained by CFT. Need MO theory – later.
Spin allowed transitions Spin forbidden transitions Ground state The intensity of an absorption is measured in terms of e Typical extinction coefficients (e) for organic dyes lie in the range e≈ 104-105 l mol-1 cm-1. In contrast, the intensities ofd-d transitions are usually very weak, with e = 5-500 l mol-1 cm-1. The reasons for this lie in the 2spectroscopic selection rules for the electronic Transition processes: 1) Spin selection rule: There must be no change inspin multiplicity, S (i.e. no change in spin “sign” for any electron in the transition). The d-d spectrum of this ion will show a series of bands at different energies - later
s orbitals are of even parity (g) invert invert invert + + p orbitals are of odd parity (u) − − + + + + − − − − + + 2) Laporte selection rule: the transition must involve a change in parity (g or u). Also Dl = 1. Orbitals are of even parity (g) if the phase sign does not change on inversion Orbitals are of odd parity (u) if the phase sign does change on inversion d orbitals are g f orbitals are u Dl = 1 l is the orbital quantum number (0 = s; 1 = p, 2 = d etc) Therefore the Laporte selection rule implies that s p or d p transitions are allowed but d d transitions are “Laporte-forbidden”. Why then are d-d transitions observed to have any intensity at all?
2- 2+ Cl H2O Tetrahedral mod. intense blue OH2 H2O OH2 Co Co Cl H2O Octahedral pale pink Cl Cl H2O Why do d-d transitions have any intensity at all? The Laporte selection rule is symmetry-based. Applies rigorously to strictly centrosymmetric systems (like free gas phase metal ions) but if the symmetry is reduced then the g/u notation has no meaning and the transitions may be weakly allowed. There are 3 main ways in which this can happen: • In a non-centrosymmetric complex the d-orbitals interact with ligand orbitals (forming MOs – see later). This reduces their symmetry so “d-d”transitions are weakly Laporte-allowed. • So: tetrahedral complexes are generally more intensely coloured than octahedral ones.
N A N A N N M B B M N B N B (b) d-dtransitionsin six-coordinate complexes can gain intensity if the centrosymmetric nature of the complex is reduced (chelates, different ligands, cis isomer etc). For example, these are not centrosymmetric: So, for example, the cis form of [M(A2B4] should be more intensely coloured than the trans form.
B B B B B M B B B M B B B B (c) For pure octahedral complexes, vibronic coupling reduces the symmetry and allows “d-d” transitions of very weak intensity. Vibronic coupling = Linked vibrational and electronic behaviour Note: Franck-Condon principle – atoms move much more slowly than electrons. If an octahedral complex undergoes an unsymmetrical vibration, an electronic d-d transition may be weakly allowed during the vibration – because the symmetry is reduced. Not centrosymmetric
Intensities of Transitions: Type emax / l mol-1 cm-1 Spin-forbidden < 1 Laporte-forbidden d-d 20-100 (6-coordinate ~ octahedral) Laporte-allowed d-d 250 - 500 (eg tetrahedral) Symmetry-allowed (not d-d) 1000-50,000 (organic dye, porphyrin, etc.) Punchline: d-d transitions are always relatively weak. They acquire more intensity as they become less centrosymmetric.
The reasons for this lie in the 2 spectroscopic selection rules for the transitions: 1) There must be no change inspin multiplicity, S (i.e. no change in spin “sign” for any electron). RECAP: The energyof a d-d absorption depends on D, which depends on the ligands The intensity of an absorption is measured in terms of e In comparison with organic dyes etc, the intensities of d-d transitions are very weak, with e = 5-500 l mol-1 cm-1. 2)Laporte selection rule: the transition must involve a change in parity (g or u). Also Dl = 1. The Laporte selection rule implies that s p or d p transitions are allowed but d d transitions are Laporte-forbidden.
At this point you should be able to: - Describe the process involved in a d-d transition - Describe the spectrochemical series - Understand and apply the selection rules for d-d transitions - Predict the number of d-d bands expected for any octahedral or tetrahedral complex ion - Describe the means by which Laporte-forbidden transitions may gain intensity Tutorial Question 7: How many spin-allowed bands will be observed in the d-d spectrum of high-spin [Mn(H2O)6]Cl3? Draw d-orbital occupancy diagrams for the excited states involved in each transition and give their spectroscopic term symbols.
Ground state Excited state lmax hn Do Do absorbance eg1,2Eg t2g1,2Tg 500 nm 20,000 cm-1 l(nm) cm-1 Recap [Ti(H2O)6]3+ shows one d-d absorption band at ~500 nm (or 20,000 cm-1). The energy of the absorption gives a direct measure of D (in this simple case): Do ≈ 20,000 cm-1 ≈ 240 kJ mol-1 The intensity of the absorption is measured in terms of the molar extinction coeff. e (absorptivity), according to Beer’s Law: Abs = ecl (l mol-1 cm-1)
Excited state 2E2g E 2D Ground state 2T2g Ligand Field Strength The lowest line represents the energy of the ground state, other lines represent excited states. Free ion zero ligand field Orgel Diagrams Any octahedral d1 complex should give a single band in its d-d spectrum. The energy of the band depends on D (and so, on the nature of the ligands). Information on the possible electronic configurations and spectra for any d1 octahedral system can be summarised on an Orgel diagram. An Orgel diagram is a plot of the energy of the possible d-orbital configurations vs. ligand field strength. Zero ligand field corresponds to the free (gas phase) ion, with all d-orbitals equivalent (and D=0).
Excited state Dwater DX 2E2g E H2O X Ground state 2T2g 2D is a free ion term symbol, it represents the configuration opposite d1 Orgel diagram 2D Ligand Field Strength (You do not need to know how to derive free ion term symbols) In d1, D is given by the separation of the two lines. (This is not always so simple.)
Dwater DX 2D 2E2g E H2O X Ligand Field Strength 2T2g This Orgel diagram describes any octahedral (or nearly octahedral) d1 system. From it we can tell: 1) The number of unpaired electrons (from the spin multiplicity) 2) The ground and excited state electron configurations 3) How many d-d bands are expected in the electronic spectrum 4) The electronic transitions responsible for the bands observed (2T2g2Eg) 5) The expected magnetic properties (from the number of upe−)
Excited state 2E E 2D 2D Ground state 2T 2E 2T Ligand Field Ligand Field E 2T2g 2T 2E 2T 2E2g 2E Tetrahedral (Td) d1 Octahedral (Oh) d9 The same diagram (though without the g subscripts) represents the tetrahedral d9 system: Consider a d1 ion in tetrahedral geometry and a d9 ion in octahedral geometry:
The Orgel diagrams for d1(Td) and d9(Oh) are the same and are the inverse of the d1(Oh) and d9(Td) diagram. This relationship applies generally, so: the Orgel diagram for d1(Oh) d9(Td) and is the inverse of d1(Td) d9(Oh) the Orgel diagram for d2(Oh) d8(Td) and is the inverse of d2(Td) d8(Oh) the Orgel diagram for d3(Oh) d7(Td) and is the inverse of d3(Td) d7(Oh) the Orgel diagram for d4(Oh) d6(Td) and is the inverse of d4(Td) d6(Oh) the Orgel diagram for d5(Oh) d5(Td) These relationships are a consequence of "hole formalism" – the configuration involving 9 electrons and 1 "hole" is related to the configuration involving 1 electron and 9 "holes". Punchline: Only 5 Orgel diagrams are required to represent any/all d-block transition metal complexes (in octahedral or tetrahedral geometry). The value of this increases in more complex systems.
3A2g Ground state 3T1gand3T1g Excited states 3T1g Excited state Systems with more than one d electron are a little more complicated. For example, in octahedral d8 complexes there is more than one d-d transition possible. Each transition is at a different energy, so the spectrum should consist of three d-d bands. Note that, although there are 6 ways of representing the configuration t2g5eg3 , they are not all of equal energy – why? They fall into two triply degenerate sets with different electron-electron repulsions.
To see why this is so, consider the related (but simpler) d2system: In the d2 system the excited state t2g1eg1can also be written in six ways: Suppose that the occupied interaxial orbital is dxy; the second electron can occupy either dx2-y2 or dz2. The dx2-y2 orbital lies in the same plane as dxy. But the principal lobes of the dz2 orbital are perpendicular to dx2-y2. The dxy/dx2-y2 combination will involve more electron-electron repulsion than the dxy/dz2 combination. The six possible arrangements fall into two sets -this is a general result for any configuration which has six possible arrangements.
1T2g(G) 1Eg(G) 3T1g(P) 1G 1T1g(G) 3P energy 1T2g(D) 1D 1A1g(G) 3T1g(F) 3F 3T2g(F) 1Eg(D) 3A2g(F) ligand field The Orgel diagram for d8 shows many lines. Some arise from the free ion ground state - indicated by (F) after the term symbol. Others arise from free ion excited states (not all included in the figure). Some of the lines are curved - states with the same term symbol curve away from each other (e.g. 3T1g(F) and 3T1g(P) ). How many d-d transitions will there be?
1T2g(G) 1Eg(G) 3T1g(P) 1G 1T1g(G) 3P energy 1T2g(D) 1D 1A1g(G) 3T1g(F) 3F 3T2g(F) 1Eg(D) 3A2g(F) ligand field 1) For d-d spectra, only transitions from the ground state are important as this is the only significantly populated state. 2) The spin selection rule means that only transitions to excited states of the same multiplicity are allowed – (other transitions from the GS are spin forbidden). There are 3 excited states of the same spin multiplicity as the ground state - so 3 allowed transitions and 3 d-d bands in the uv-vis spectrum. These would be designated as follows: lowest energy n1 = 3A2g3T2g(F) The energy of the bands depends on the ligand field (ie on the nature of the cation and the ligands). n2 = 3A2g3T1g(F) highest energy n3 = 3A2g3T1g(P)
1I 3G 5Eg 3F 3H 1T2g 5D 1T1g X Y 5T2g Z 1A1g Ligand Field Simplified Orgel diagram for a d6 ion (e.g. Fe2+) in octahedral geometry: New feature: the ground state (lowest energy configuration) depends on the strength of the ligand field – ie on D. In weak ligand fields (X) the GS is 5T2g - ie high-spin, with 4 upe. Only one d-d band is expected. In strong ligand fields (Y) the GS is 1A1g, ie low-spin with no upe. Two d-d bands are expected. Energy The changeover occurs at LF = Z - the point where P ≈ D This is also the condition for observing a spin-transition in the magnetic behaviour - ie spin crossover occurs at ligand fields close to Z.
Recap Orgel diagrams allow us to interpret d-d spectra, e.g. to predict the number of bands that will be observed and to explain their origin. In the simplest case of a d1 system, the value of D could be obtained directly from the position of the only d-d band observed. In systems with more than one electron, calculation of D is generally more complex because other factors contribute to the energy required for the electronic transitions. These are: 1) electron-electron interactions 2) interactions between excited states. These quantities can be extracted from electronic spectral data – but to understand how this can be done would require a closer look at the construction of the Orgeldiagrams – not now.
Tutorial question 8. The Orgel diagram for a particular metal ion is shown opposite. Answer the following questions with reference to the diagram and explain your reasoning in each case. • (i) What are the quantities A and B plotted on the axes? • Explain the meaning of all the terms in the symbol 2E. • How many d electrons does the metal ion possess? • How many d-d bands would be observed in the spectra of complexes involving this ion? • How would the d-d spectrum of a complex represented by Y differ from one represented by Z? • At this point you should be able to: • Understand the construction of Orgel diagrams • Use Orgel diagrams to deduce the properties of ions
Stabilities of complexes – Crystal Field Stabilisation Energy Predicting the stability constant for a given complex is difficult because there are many different factors which may influence thermodynamic stability. The most important of these are: 1) Charge 2) Ionic size 3) Ionisation Potential 4) Electroneutrality Principle 5) Chelate effect 6) HSAB of metal & ligands 7) CFSE (Crystal Field Stabilisation Energy) The last factor applies to transition metal complexes only. The others apply to any metal complex.
[M(OH)(n-1)+] K1 = [Mn+] [OH−] 1) Charge: High charge on either metal or ligand leads to stronger interaction and therefore higher stability constants. K1 = stability constant for binding the first ligand Mn+ + OH− → M(OH)(n-1)+ 2) Ionic size: For constant charge, charge density increases as ionic size decreases. Therefore we expect that thermodynamic stability is inversely proportional to ionic size.
3) Ionisation Potential: Ionisation potential gives an indication of how tightly an atom holds on to electrons (its own or shared). The list shows a maximum at Cu2+, so stability constants might be expected to go through a maximum at Cu2+ (all other things being equal). So a higher ionisation energy implies a more stable complex (assuming some covalent bonding). This is the reason behind the empirically observed Irving-Williams stability order: Mn2+ < Fe2+ < Co2+ < Ni2+ < Cu2+ > Zn2+
+ +½ NH3 NH3 NH3 + +½ 3- + 0 +½ NH3 NH3 NH3 3+ + Co Co Co NH3 NH3 NH3 H3N H3N H3N +½ + H3N H3N H3N + +½ +½ NH3 NH3 NH3 4) Electroneutrality principle: Recall: in a stable species the metal ion will try to acquire an effective charge not very different from zero. eg get: [FeIIIF6]3− F−is hard - ionic bond [FeIIICl4]−and [FeIIIBr4]− Cl−and Br−are softer, more covalent [FeIII4]2− I− reduces Fe(III) to Fe(II) (e− transferred) The electroneutrality principle gives a result closer to the real electron density distribution than either the totally ionic model (no electron density shared) or the totally covalent model (electrons equally shared in every bond). Ionic model covalent model electroneutrality model
very small contribution to DS [Ni(H2O)6]2+ + 6NH3[Ni(NH3)6]2+ + 6H2O 7 species 7 species [Ni(H2O)6]2+ + 3en [Ni(en)3]2+ + 6H2O large positive contribution to DS 4 species 7 species 5)Chelate Effect: For a series of ligands of different denticity, the thermodynamic stability increases as the number of donor atoms increases: [Ni(NH3)6]2+ monodentate b6 = 108 (stability constant for binding 6 ligands) [Ni(en)3]2+ bidentate b3 = 4 x 10¹⁸ [Ni(dien)2]2+ tridentate b2 = 8 x 10¹⁸ (dien = H2NCH2CH2NHCH2CH2NH2) The main reason is an entropy effect - there is a marked increase in entropy (disorder) on formation of a chelate complex: Free energy DG = DH - TDS = -RT logb A significant positive DS makes DG more -ve and the reaction more favoured.
N N M N N NH2 N Alternate view: once one of the N donors of en is bonded to the metal, the second donor is held close to the metal and is more likely to bind than if it were a free monodentate ligand. The uncoordinated amine group is held in the vicinity of the vacant coordination site by the coordinated donor. The reverse is also true, if one N donor dissociates, it cannot move away from the metal and is more likely to re-associate than if it were a monodentate ligand.
eg E t2 Do 2/5Dt spherically symmetric Dt 3/5Dt e t2g tetrahedral octahedral 3/5Do 2/5Do 7) Crystal Field Stabilisation Energy (CFSE): Applies only to complexes of transition metal ions. CFSE is the stabilisation of a given complex ion relative to its energy if the d-orbitals were not split. Recall the centre of gravity rule: A value for the stabilisation of a particular configuration, known as the Crystal Field Stabilisation Energy (CFSE), can be calculated in terms of D. If D is determined from spectral data, it is possible to calculate a quantitative value for the ligand field stabilisation energy - LFSE.
stabilisation destabilisation dn Total CFSE −2/5D −2/5D d1 eg −4/5D −4/5D d2 −6/5D −6/5D d3 Do −6/5D 3/5D −3/5D d4 −6/5D 6/5D d5 0 t2g 3/5Do 2/5Do −8/5D 6/5D −2/5D d6 octahedral −10/5D 6/5D −4/5D d7 −12/5D 6/5D −6/5D d8 −12/5D 9/5D −3/5D d9 −12/5D 12/5D d10 0 CFSE for high-spin octahedral complexes: Note: CFSE values are always 0 i.e. it is never destabilising (if it were, the complex would not form).
stabilisation destabilisation dn Total CFSE d1 −2/5D −2/5D d2 −4/5D −4/5D d3 −6/5D −6/5D d4 −8/5D −8/5D +P P vs −10/5D +2P d5 −10/5D 2P −12/5D +2P d6 −12/5D 2P d7 −12/5D 3/5D+P −9/5D +P vs −6/5D d8 −12/5D 6/5D −3/5D d9 −12/5D 9/5D 0 d10 −12/5D 12/5D CFSE for low-spin octahedral complexes – pairing energy must be considered:
-6/5Do high-spin Oh high-spinTd -6/5Dt 10 0 1 2 3 4 5 6 7 8 9 Sc2+ Fe2+ Co3+ Ti2+ V2+ Cr2+ Mn2+ Fe3+ Co2+ Ni2+ Cu2+ The same exercise can be carried out for tetrahedral geometries. The results are plotted in the following diagram. In high-spin complexes CFSE = 0 for d0, d5 and d10 (spherically symmetrical). CFSE In tetrahedral geometries max CFSE = −6/5Dt for d2 and d7. In high spin octahedral geometries, max CFSE = −6/5Do for d3 and d8. (Recall Dt4/9 Do) CFSE of an ion in octahedral geometry will always be at least as large as for an equivalent ion in tetrahedral geometry, and usually larger. For d1, d2, d5, d6 and d7 the CFSE advantage of octahedral over tetrahedral geometry in small, BUT for d3 and d8 octahedral is strongly favoured.
-12/5Do low-spin Oh high-spin Oh high-spinTd -6/5Do 10 0 1 2 3 4 5 6 7 8 9 Sc2+ Fe2+ Co3+ Ti2+ V2+ Cr2+ Mn2+ Fe3+ Co2+ Ni2+ Cu2+ -6/5Dt CFSE Add in low-spin octahedral: In low-spin complexes CFSE = 0 for d0 and d10. In low spin octahedral geometries max CFSE = -12/5D for d6. (Large Do) Is there any evidence for extra stability due to CFSE effects?
Evidence for CFSE effects (Ligand Field Stabilisation Effects) Values for CFSE calculated from spectra are in the range 100-400 kJ mol-1. This is the same sort of energy as required for many chemical changes, so CFSE should be an important contributor to the overall stability of a complex (though not the major contribution). If LFSE effects are important, there should be evidence in other physical properties 1) Solid State - Spinel minerals The spinels have general formula AIIBIII2O4 (where A and B are metal ions) The metal ions are located in either tetrahedral or octahedral sites formed by the packing of the oxo ions. In a “normal” spinel, the A2+ ions occupy tetrahedral sites and B3+ ions occupy octahedral ones. In an “inverse” spinel, the A2+ ions occupy octahedral sites, half the B3+ ions also occupy octahedral sites and the other half are in tetrahedral sites. It is possible to predict which of the two forms will be adopted by a given spinel on the basis of the CFSE.
Co2+ d7 in octahedral geometry Co2+ d7 in tetrahedral geometry e.g. for CoIIFeIII2O4: assume all ions are high spin Dt = 4/9Do Do = 9300 cm-1 for Co2+ with oxide ligands Do = 14300 cm-1 for Fe3+ with oxide ligands CFSE = -(5 x 2/5Do) + (2 x 3/5Do) = -4/5Do = -7440 cm-1. CFSE = -(4 x 3/5Dt) + (3 x 2/5Dt) = -6/5Dt = -4960 cm-1. Fe3+ d5CFSE = 0 in either geometry. For a normal spinel with Co2+ tetrahedral and Fe3+ octahedral: Total CFSE = -4960 + 2(0) = -4960 cm-1 For an inverse spinel with Co2+ in octahedral geometry and half the Fe3+ in each type of site: Total CFSE = -7440 + 0 + 0 = -7440 cm-1 So the inverse arrangement is preferred - this is what is observed.
3000 F Lattice Energies (kJ mol-1) Cl Br I 2000 Sc Ti V Cr Mn Fe Co Ni Cu Zn Ga Ca 2) Lattice Energies - Energy released for: M2+(g) + 2X-(g) MX2(s) Lattice energies of halide salts from Ca to Ga. The metal ions occupy octahedral sites. All four plots have the same shape Ca2+, Mn2+ and Zn2+ (which have no LFSE) lie on a smooth curve The max deviations from the curve are at V2+ and Ni2+ (d3 and d8), which have the largest LFSE (-6/5Do). The “extra” lattice energy, above the smooth curve is consistent with the pattern expected from CFSE considerations. CFSE is a small contribution to the total lattice energy - but responsible for the non-linear, "double-humped" nature of the curve.
experimental 3000 corrected +3 ions Heats of Hydration (kJ mol-1) 2000 Ga Ti Ca Sc V Cr Mn Fe Co Ni Cu Zn 3) Hydration energies M2+(g) + nH2O M2+(aq) +2 ions +2 ion plot has the same shape as the lattice energy plots. A smooth line passes through Ca2+, Mn2+ and Zn2+ (no CFSE). If the values are corrected for the CFSE, the points marked are obtained. The new values lie close to the smooth curve, supporting the idea that the irregularities are due to CFSE. +3 ions show a similar pattern but the d5 system here is Fe3+, accounting for the shift in the central minimum.
3) Stability constant data Stepwise stability constants normally drop as successive ligands are added for statistical reasons. (K1 > K2 > K3 …) For the reaction: [Fe(H2O)6]2+ + 3 phen [Fe(phen)3]2+ + 6H2O the stepwise stability constants vary as: K1 > K2 << K3. Why? In this case the final complex [Fe(phen)3]2+ is low spin while [Fe(H2O)6]2+, [Fe(H2O)4(phen)]2+ and [Fe(H2O)2(phen)2]2+ are all high spin. High spin Fe2+ d6CFSE = -2/5D Low spin Fe2+ d6CFSE = -12/5Do The big gain in CFSE on addition of the third phen ligand accounts for the large stepwise stability constant for the final step.
4) Inert and labile complexes Complexes of Co3+, Cr3+ and Pt2+ are inert i.e. their ligand substitution reactions are slow (a kinetic, rather than thermodynamic effect). Why these ions in particular? Co3+ Oh d6 low spin CFSE -12/5D Cr3+ Oh d3CFSE -6/5D Pt2+ Sq. pl. d8 low spin max CFSE To carry out a ligand substitution one of two things must happen, either: there is an intermediate of lower coordination number (dissociative) or there is an intermediate of higher coordination number (associative).
In either case there must be a change in coordination number: Co3+, Cr3+ and Pt2+must lose some CFSE in going to the intermediate geometry (e.g. a square pyramid). This acts as an extra contribution to the activation energy for the substitution process and reduces the reaction rate. Octahedral Co3+ is usually low spin but 5-coordinate Co3+ is likely to be high spin – going from 6- to 5-coordinate costs CFSE. Low spin Fe2+ is also relatively inert but Fe2+ also forms many high-spin complexes. Ni2+ in square planar geometry might be expected to be inert. It reacts quite slowly but is not as inert as Pt2+, because most Ni2+ complexes are tetragonal rather than square planar and the loss of CFSE is less marked in this case.
At this point you should be able to: • List the factors contributing to the stability of complex ions • Define CFSE and deduce expressions for CFSE of various ions • Discuss experimental evidence for CFSE effects Tutorial question 9. a) Assuming a linear relationship between lattice energy and atomic number, calculate the lattice energy of NiF2, given the following information: MnF2 lattice energy = 2782 kJ mol-1 ZnF2 lattice energy = 2986 kJ mol-1 . (Assume all the metal ions are high-spin and have octahedral coordination geometry.) b) The measured value for the lattice energy of NiF2 is 3064 kJ mol-1. Account for any difference from the value calculated in (a). c) Use the information in parts (a) and (b) to calculate the crystal field splitting energy (D) for NiF2.