Download
1 / 20
790 likes | 4.65k Views
Electronic Spectra of Coordination Compounds. 201450096 권태욱. [Contents]. 1) Selection rule 2) Correlation Diagram 3) Tanabe sugano Diagram 4) Charge transfer Spectrum. 1. Selection Rule. 1) Laporte selection rule. - Transition between state of the same parity are forbidden.

E N D
Electronic Spectra of Coordination Compounds 201450096 권태욱
[Contents] • 1) Selection rule • 2) Correlation Diagram • 3) Tanabe sugano Diagram • 4) Charge transfer Spectrum
1. Selection Rule 1) Laporte selection rule - Transition between state of the same parity are forbidden. ex) Transition between d orbitals are forbidden. (g → g transition) But between d and p orbitals are allowed. (g →u transition)
1. Selection Rule 2) Spin Selection Rule - Transition between state of different spin multiplicities are forbidden ex) Transition between ⁴A₂and ⁴T₁state are “spin-allowed” But ⁴A₁and ²A₂are “spin-forbidden”
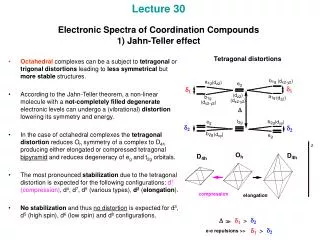
1. Selection Rule 3) Mechanism for rules can be relaxed • Vibronic coupling : The bond in transition metal complexes are not rigid but undergo vibration that may temporarily change the symmetry. Provide way to relax the Laporte selection rule • Ex) Oh complex • – Vibrate in way in which the center of symmetry is • temporarily lost. So d-d transitions having molar • absorptivities in the range of approximately 10~50 L / mol * ㎝
1. Selection Rule 3) Mechanism for rules can be relaxed • Tetrahedral complexes often absorb more strongly then octahedral • complex of same metal in the same oxidation state. • Spin-orbit coupling in some cases provides a mechanism of relaxing the second selection rule.
2. Correlation diagram • Free ions (No ligand field) • - Term symbol of d² configuration : ³F, ³P, ¹G, ¹D, ¹S • - Lowest energy : ³F • Strong ligand field • - three possible configuration
2. Correlation diagram • Splitting of Free-Ion Terms • -Irreducible representations are produced. • : Examine the correlation diagram and the Oh table. • Each state has symmetric characteristics of that IR. • IRs are also obtained from the strong-field limit configurations
3. Tanabe-Sugano diagram • Special correlation diagrams useful in the interpretation • of electronic spectra. • - Lowest energy state is plotted along the horizontal axis. • o/B (field strength) • - Vertical axis is the measure of the energy above the ground state • E/B B = Racah parameter, a measure of the repulsion between terms of the same multiplicity. • - Lines connecting states of the same symmetry cannot cross.
3. Tanabe-Sugano diagram • Simplified Tanabe-sugano diagram • of d² electronic configuration in • octahedral ligand field • Tanabe –sugano diagram • for d² in octahedral ligand field
3. Tanabe-Sugano diagram • The diagrams for configurations d4-d6 have a vertical “break” in the • middle of the diagram. This is due • to the shift from a high spin (weak • field) complex to a low spin (high • field) complex
3. Tanabe-Sugano diagram ν3 ν2 ν1 Each peak is due to the 4A2g(F)4T2g(F) 4T1g(F) 4T1g(P)transition. ν1 ν2 ν3
4. Charge Transfer Spectra • Many transition metal complexes exhibit strong • charge-transfer absorptions in the UV or visible range. • These are much more intense than d d transitions, • with extinction coefficients ≥ 50,000 L / mol * cm • (as compared to 20 L / mol * cm for d d transitions • In charge transfer absorptions, electrons from molecular orbitals • that reside primarily on the ligands are promoted to molecular orbitals • that lie primarily on the metal. This is known as a charge transfer to • metal(CTTM) or ligand to metal charge transfer (LMCT). • The metal is reduced as a result of the transfer
4. Charge Transfer Spectra _ _ eg d _ _ _ _ _ _ _ _ t2g _ _ _ _ _ _ _ _ _ _ _ _ free metaloctahedral complexligand σ orbitals Ligand to metal charge transfer
4. Charge Transfer Spectra • LMCT occurs in the permanganate ion, MnO41-. • Electrons from the filled p orbitals on the oxygens are promoted • to empty orbitals on the manganese. • The result is the intense purple color of the complex.
4. Charge Transfer Spectra • MLCT typically occurs in complexes with π acceptor ligands. • The empty π* orbitals on the ligands accept electrons from • the metal upon absorption of light. The result is oxidation of the metal.
4. Charge Transfer Spectra _ _ _ _ _ _ _ _ _ _ _ π* _ _ eg d _ _ _ _ _ _ _ _ t2g free metal octahedral complex ligand π* orbitals Metal to ligand charge transfer
4. Charge Transfer Spectra • Examples of MLCT include iron(III) with acceptor • ligands such as CN- or SCN1-. • The complex absorbs light and oxidizes the • iron to a +4 oxidation state. • The metal may be in a low oxidation state (0) with carbon monoxide as the ligand. Many of these complexes are brightly colored, and some appear to exhibit both types of electron transfer.