Download
1 / 22
220 likes | 296 Views
Market Distortions Caused by Government Policies. All such programs cause a net loss to the economy. Gain is usually to the producers who lobby Congress. Loss is borne by millions of unorganized and unknowing consumers. S ’. S. P S. D. P 0. C. D. Q 1. Q 0.

E N D
Market Distortions Caused by Government Policies All such programs cause a net loss to the economy. Gain is usually to the producers who lobby Congress. Loss is borne by millions of unorganized and unknowing consumers.
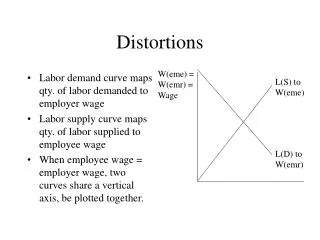
S’ S PS D P0 C D Q1 Q0 Supply Restrictions: General Analysis Price A B • CS reduced by A + B Cost to government = B + C + D = additional profit made if producing Q0 at PS • Change in PS • = A + B + D Quantity
S Pmin P0 C D D Q3 Q0 Q2 Minimum Prices: Sound Good to Producers But Do Not Work Well Price If producers produce Q2, the amount Q2 - Q3 will go unsold. B A D measures total cost of increased production not sold The change in producer surplus will be A - C - D. Producers may be worse off. Quantity
Price Supports • Much of agricultural policy is based on a system of price supports. • Price set by government above free-market level and maintained by governmental purchases of excess supply • Government can also increase prices through restricting production, directly or through incentives to producers
Price Supports • What are the impacts on consumers, producers and the federal budget? • Consumers • Quantity demanded falls and quantity supplied increases • Government buys surplus • Consumers must pay higher price for the good • Loss in consumer surplus equal to A+B
Price Supports • Producers • Gain since they are selling more at a higher price • Producer surplus increases by A+B+D • Government • Cost of buying the surplus which is funded by taxes so indirect cost on consumers • Cost to government = (Q2-Q1)PS
S Qg Ps D P0 D + Qg E D Q1 Q0 Q2 Price Supports Price To maintain a price Ps the government buys quantity Qg . A B Net Loss to society is E + B Quantity
Price Supports • Government may be able to “dump” some of the goods in the foreign markets • Total welfare effect of policy CS + PS – Govt. cost = D – (Q2-Q1)PS • Society is worse off over all • Less costly to simply give farmers the money
S Qg P0 = $3.70 C A B P0 = $3.46 D + Qg D 1,800 2,566 2,630 2,688 Example: The Wheat Market in 1981 Price • AB consumer loss • ABC producer gain By buying 122 million bushels the government increased the market-clearing price. Quantity
Supporting the Price of Wheat • In 1985, the situation became worse • Export demand fell and the market clearing price of wheat fell to $1.80/bushel. • Equilibrium quantity was 2231 • The actual price, however, was $3.20 • To keep price at $3.20, the government had to purchase excess wheat • Government also imposed a production quota of about 2425 million bushels
Supporting the Price of Wheat • 1985 Government Purchase: • 2,425 = 2,580 - 194P + QG • QG = -155 + 194P • P = $3.20 -- the support price • QG = -155 + 194($3.20) = 466 million bushels
QS S’ S P0 = $3.20 P0 = $1.80 D + QS D 1,800 1,959 2,232 2,425 Quantity The Wheat Market in 1985 Price To increase the price to $3.20, the government bought 466 million bushels and imposed a production quota of 2,425 bushels.
Supporting the Price of Wheat • 1985 Government Cost: • Purchase of Wheat = $3.20 x 466 = $1,491 million • 80 cent subsidy = .80 x 2,425 = $1,940 million • Total government program cost = $3.5 billion
Import Quotas and Tariffs • Many countries use import quotas and tariffs to keep the domestic price of a product above world levels • Import quotas: Limit on the quantity of a good that can be imported • Tariff: Tax on an imported good • This allows domestic producers to enjoy higher profits • Costs to consumers is high
Import Quotas and Tariffs • With lower world price, domestic consumers have incentive to purchase from abroad. • Domestic price falls to world price and imports equal difference between quantity supplied and quantity demanded • Domestic industry might convince government to protect industry by eliminating imports • Quota of zero or high tariff
S P0 A B C PW Imports D QS Q0 QD Import Tariff To Eliminate Imports Price In a free market, the domestic price equals the world price PW. Quota of zero pushes domestic price to P0 and imports go to zero. Loss to consumers is A+B+C. Gain to producers is A. Dead weight loss: B +C. Quantity
The increase in price can be achieved by a tariff. QS increases and QD decreases Area A is the gain to domestic producers. The loss to consumers is A + B + C + D. DWL = B + C Government Revenue is D = tariff * imports S P P* B D C A Pw D Q QS Q’S Q’D QD Import Tariff (general case)
If a quota is used, rectangle D becomes part of the profits to foreign producers Consumers lose A+B+C+D Producers gain A Net domestic loss is B + C + D. S P P* B D C A Pw D Q QS Q’S Q’D QD Import Quota (general case)
The Sugar Quota Example • The world price of sugar has been as low as 4 cents per pound, while in the U.S. the price has been 20-25 cents per pound. • Sugar quotas have protected the sugar industry but driven up prices • Domestic producers have been better off and so have some foreign producers that have quota rights • Consumers are worse off
The Sugar Quota Example • The Impact of a Sugar Quota in 2001 • U.S. production = 17.4 billion pounds • U.S. consumption = 20.4 billion pounds • U.S. price = 21.5 cents/pound • World price = 8.3 cents/pound • Price elasticity of US supply = 1.5 • Price elasticity of Us demand is –0.3
Impact of Sugar Quota • The data can be used to fit the US supply and demand curves • QS = -8.70+ 1.21P • QD = 26.53 - 0.29P • World price was 24.2 million pounds leading to little domestic supply and most domestic consumption coming from large imports • Government restricted imports to 3 billion pounds raising price to 21.5 cents/pound
DUS SUS Price (cents/lb.) PUS = 21.5 after quota 20 A 16 11 PW = 8.3 before quota 8 4 Quantity (billions of pounds) 1.4 17.4 20.4 24.2 Sugar Quota in 1997 B C D The cost of the quotas to consumers was A + B + C + D = $2.4b. The gain to producers was area A = $1b.