
Uploaded by
sora
4 SLIDES
204 VIEWS
40LIKES
Figure 1 supplementary
DESCRIPTION
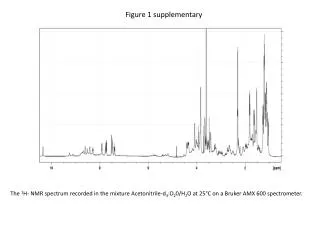
Figure 1 supplementary. The 1 H- NMR spectrum recorded in the mixture Acetonitrile-d 3 :D 2 0/H 2 O at 25°C on a Bruker AMX 600 spectrometer. Figure 2 supplementary.
Download
1 / 4
Download Presentation 
Figure 1 supplementary
An Image/Link below is provided (as is) to download presentation
Download Policy: Content on the Website is provided to you AS IS for your information and personal use and may not be sold / licensed / shared on other websites without getting consent from its author.
Content is provided to you AS IS for your information and personal use only.
Download presentation by click this link.
While downloading, if for some reason you are not able to download a presentation, the publisher may have deleted the file from their server.
During download, if you can't get a presentation, the file might be deleted by the publisher.
E N D
Presentation Transcript
Figure 1 supplementary The 1H- NMR spectrum recorded in the mixture Acetonitrile-d3:D20/H2O at 25°C on a Bruker AMX 600 spectrometer.
Figure 2 supplementary NAI-802 monoamide with ethylendiamine MS full-scan low resolution spectrum showing a doubly protonated ion at m/z 1080 and a triple protonated ion at m/z 720.
Figure 3 supplementary The HSQC spectrum recorded in the mixture Acetonitrile-d3:D2O at 25°C on a Bruker AMX 600 spectrometer.
Figure 4 supplementary The HMBC spectrum recorded in the mixture Acetonitrile-d3:D2O at 25°C on a Bruker AMX 600 spectrometer.


More Related
Audio
Live Player