Download
1 / 24
240 likes | 368 Views
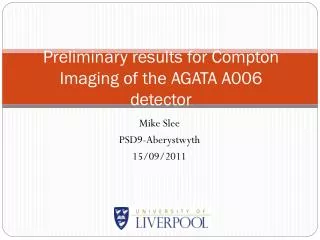
Preliminary results for Compton Imaging of the AGATA A006 detector. Mike Slee PSD9-Aberystwyth 15/09/2011. Motivation. Data has been taken with the AGATA A006 detector to develop Compton imaging capabilities. Overview. Introduction to AGATA

E N D
Preliminary results for Compton Imaging of the AGATA A006 detector Mike Slee PSD9-Aberystwyth 15/09/2011
Motivation • Data has been taken with the AGATA A006 detector to develop Compton imaging capabilities.
Overview • Introduction to AGATA • Introduce Gamma-ray tracking and Pulse Shape Analysis • Compton Imaging • Preliminary results of energy and position • Pulse Shape Analysis in greater detail
Introduction to AGATA • The AGATA project is part of the next generation of high resolution gamma spectroscopy arrays. • These arrays improve the photopeak efficiency to around 40% @ 1332KeV • Achieved by creating a 4 π ball of Germanium (Ge) composed of 180 HPGe crystals around the target, removing Bismuth Germinate (BGO) suppression shield. • Utilising gamma-ray tracking to reconstruct interactions of Compton scattered gamma-rays. Compton rejected Full energy accepted
Gamma-ray Tracking • Use a high fold segmented Germanium detector and utilise electronics to process the digital signal. • Using the information on the positions of the interaction points and the energies , the tracks of the gamma-rays can be reconstructed. • Able to extract energy, timing and spatial information on the interactions through Pulse Shape Analysis of signals. Source
PSA • Pulse Shape Analysis makes use of the differences in signal shapes observed. • Shorter time for the charge carriers to reach electrode due to close proximity. • Important to have detailed understanding of the pulse shapes to have accurate gamma-ray tracking. One way to test this is to use Compton Image Reconstruction, this also has imaging applications.
Compton Image reconstruction This is based around the principles of Compton scattering, the most likely interaction mechanism for gamma-rays, in the energy range of 150 keV to 1.5 MeV. (G.F Knoll, 2000) The angle a gamma ray scatters can be predicted by the Klein-Nishina formula. This takes into account the rate of scattering events normalized to the incident intensity, the material density, the size and the efficiency of the detector. (G.F Knoll, 2000)
Compton Image reconstruction • 2 detectors. Front optimised for Compton scattering and the rear optimised for photo-electric absorption
Interaction 2 Interaction 1 Cone ɵ Scatter Absorber Scatter angle Energy deposited in the first interaction and total energy of gamma-ray determines the incident angle. Where Source
The three main sources of error are : 1) Finite energy resolution of detector. 2) Finite position resolution of the detector. 3) Non –zero momentum of the bound electron . The first and third sources of error affect the determination of the opening angle of the cone and the final one affects the determination of the axis. To reduce these errors a gamma-ray detector with excellent energy and position resolution is required.
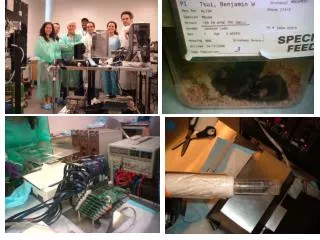
Experimental Method • Reconstructing data from a single AGATA crystal. • A 137 Cs source was placed directly below the centre (i.e. segment intersection point) of the crystal front face. • Preliminary position and energy results.
Energy Resolution FWHM = 2.45 keV@662 keV
Interaction sites within the detector Segment Layout Second hit segment First hit segment
Pulse Shape Analysis • Charge pulse from gamma-ray interaction contains information on event . • Aim to study different approaches to position determination. • Future work is to analyse PSA using library methods and parametric methods.
Parametric PSA • Analysis of the rise time (T30 – T90) and image charge asymmetry. • Pulses from the outer edge of the crystal respond quicker, electrons to outer cathode and holes to anode. • Analysis of the pulses enable the depth of interaction to be located.
T30 vs T90 T90 T30
Parametric PSA Image Charge Real Charge
Parametric PSA • Image Charge asymmetry varies with lateral interaction position
Parametric PSA • Image Charge asymmetry varies with lateral interaction position
Parametric PSA • Image Charge asymmetry varies with lateral interaction position
BASIS • Event by event comparison of pulse shapes with a basis dataset. • c2minimisation to find best match between observed pulse and generated dataset pulse. • Advantage of this method is the whole pulse analysed . • Better determination of position.
Current and Further Work • Instead of using the centroid as the position of interaction in a segment use analysis of the pulse shapes and comparison of basis dataset to improve the position resolution. • Comparison of position resolution from different rings, greater distance creates a narrower cone. • Investigate the minimum number of cones required to create a coherent image.
Acknowledgements A J Boston, H Boston, S J Colosimo, F Filmer, L J Harkness, M Jones, D S Judson, S Moon, D C Oxley, D P Scraggs, A Sweeney, C Unsworth and AGATA collaboration