Download
1 / 19
190 likes | 267 Views
Investigating the relationship between ant colony size and energy acquisition rates through field observations and model predictions. The study aims to understand why large colonies have shorter foraging times than predicted, proposing a revised model and predicting foraging time, territory area, and travel time based on density of foragers. The research findings suggest that large colonies may compensate for longer travel times by exploiting richer seed patches and increasing forager density. Future steps involve model validation, additional field tests, and seed manipulation experiments.

E N D
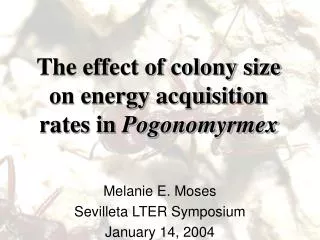
The effect of colony size on energy acquisition rates in Pogonomyrmex Melanie E. Moses Sevilleta LTER Symposium January 14, 2004
Introduction • Most organisms show a nonlinear relationship between body size and energy acquisition rates • Jun et al (2003) predict a nonlinear relationship between ant colony size and energy acquisition • Predictions were tested with field observations at the Sevilleta LTER and in Portal, AZ. • A revised model is proposed and will be tested with future field experiments
Pogonomyrmex species at the Sevilleta and Portal, AZ Colony growth is sigmoidal, and oscillates with seasons Species are relatively similar in ecology, behavior and ant size
Foraging in Pogonomyrmex • Single load, central place foragers • Generalist seed diet + termites • High foraging efficiency (Espent/Eacquired < 1%) • Time minimizers • Temp, humidity, rainfall greatly impact foraging • Foraging time = travel time + search time Tf = Tt + Ts Ts >> Tf
Allometric Foraging ModelJun et al 2003 • Derived from West et al allometric models, considers how colony size and use of space (territory area) affect foraging times • Assumes that when diet, environment, food resources, etc. are equal, larger colonies require a larger territory in which to forage • Predicts that the average time to acquire each seed is a function of the number of foragers (F) in the colony: Tt ~ F1/3 • Diminishing returns/self shading • The rate of energy acquisition per forager declines ~ F-1/3 • Total energy acquired by the colony ~ F2/3
Field Methods • Follow marked foragers of each spp to determine • Travel time (Tt) • Search time (Ts) • Total foraging time (Tf) • Distance to seeds (d) • Territory area (A) • Estimate # of foragers • Flow of ants * Tf
Foragers in bigger colonies travel furtherbut exponent is < model prediction of 1/3 P. barbatus travel significantly further (10m) than P. desertorum and P. maricopa (6m)
BUT Tf is constant across colony sizes Total foraging time vs F
Summary of field data Larger colonies had • larger territories • longer foraging distances • longer travel times • but total foraging times were not significantly different across colony sizes
Why are large colony foraging times shorter than model predictions? Model • Assumes search time is negligible • Assumes foragers fill space at constant density • Assumes seed density is constant across foraging areas Data • Search time is > 60% of foraging time • Forager density in large Pogo colonies is twice that in small colonies • Seed density was not measured
A revised model of ant foraging Use the approach of the Jun model: ants are “space filling” and rate minimizing Three changes to the model: • Consider Ts as a component of foraging time • Allow density of foragers (F) to vary Increased Fdecreasestravel time (Tt) increasessearch time (Ts) • Allow large colonies to exploit high density seed patches
Model Predictions • Density of foragers: F~ F1/3 (s4/3) • Territory Area: AT ~ F2/3(s-4/3) • Travel time: Tt ~ F1/3(s-2/3) • Search time: Ts ~ F1/3 (s-2/3) + (1/s) Foraging time (Tf) is equal if P. barbatus forage in areas with twice the seed density (s) of P. desertorum
Next steps • Validate model with simulations • Test model with additional field data • Experimental seed manipulations • Does forager density increase when seed density increases? • Are larger colonies better at exploiting dense seed patches?
Conclusions • Large Pogonomyrmex colonies have larger territories and longer foraging travel times than small colonies • Large colonies may compensate for increased travel times by • Finding richer seed patches • Increasing forager density • Seed manipulation experiments are being designed to test these predictions
Thanks! Bruce Milne & lab Jim Brown & lab Ric Charnov Hilary Lease “The Ant Course” & Southwest Research Station Sevilleta LTER EPA STAR NSF BiocomplexityNM GRD NM AGEP