Download
1 / 20
200 likes | 287 Views
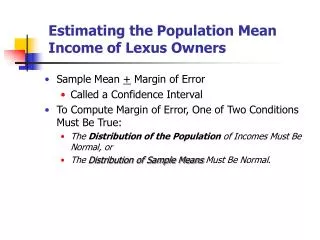
Estimating the Population Mean Income of Lexus Owners. Sample Mean + Margin of Error Called a Confidence Interval To Compute Margin of Error, One of Two Conditions Must Be True: The Distribution of the Population of Incomes Must Be Normal, or

E N D
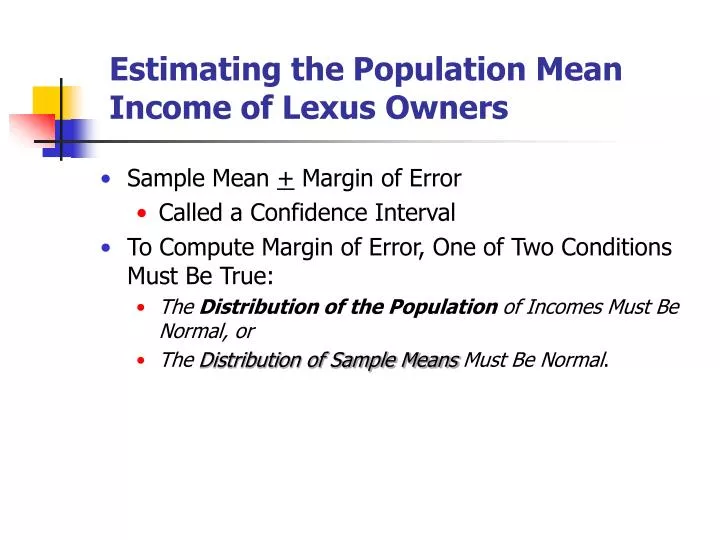
Estimating the Population Mean Income of Lexus Owners • Sample Mean + Margin of Error • Called a Confidence Interval • To Compute Margin of Error, One of Two Conditions Must Be True: • The Distribution of the Population of Incomes Must Be Normal, or • The Distribution of Sample Means Must Be Normal.
A Side-Trip Before Constructing Confidence Intervals • What is a Population Distribution? • What is a Distribution of the Sample Mean? • How Does Distribution of Sample Mean Differ From a Population Distribution? • What is the Central Limit Theorem?
Assume Small Population of Lexus Owners’ Incomes (N = 200)
Mean Distribution of N = 200 Incomes 30 75 125 175 225 275 325
Mean Obs 1 Obs 2 Obs 3 Obs 4 Obs 5 Constructing a Distribution of Samples of Size 5 from N = 200 Owners
Estimated Std. Error Distribution of Sample Mean Incomes (Column #7) Distribution of Sample Means Near Normal!
Central Limit Theorem • Even if Distribution of Population is Not Normal, Distribution of Sample Mean Will Be Near Normal Provided You Select Sample of Five or Ten or Greater From the Population. • For a Sample Sizes of 30 or More, Dist. of the Sample Mean Will Be Normal, with • mean of sample means = population mean, and • standard error = [population deviation] / [sqrt(n)] • Thus Can Use Expression:
Why Does Central Limit Theorem Work? • As Sample Size Increases: • Most Sample Means will be Close to Population Mean, • Some Sample Means will be Either RelativelyFar Above or Below Population Mean. • A Few Sample Means will be Either Very Far Above or Below Population Mean.
Impact of Side-Trip on MOE • Determine Confidence, or Reliability, Factor. • Distribution of Sample Mean Normal from Central Limit Theorem. • Use a “Normal-Like Table” to Obtain Confidence Factor. • Determine Spread in Sample Means (Without Taking Repeated Samples)
Drawing Conclusions about a Pop. Mean Using a Sample Mean Select Simple Random Sample Compute Sample Mean and Std. Dev. For n < 10, Sample Bell-Shaped? For n >10 CLT Ensures Dist of Normal Draw Conclusion about Population Mean, m
Federal Aid Problem • Suppose a census tract with 5000 families is eligible for aid under program HR-247 if average income of families of 4 is between $7500 and $8500 (those lower than 7500 are eligible in a different program). A random sample of 12 families yields data on the next page.
Federal Aid Study Calculations Representative Sample 7,300 7,700 8,100 8,400 7,800 8,300 8,500 7,600 7,400 7,800 8,300 8,600
Estimated Standard Error • Measures Variation Among the Sample Means If We Took Repeated Samples. • But We Only Have One Sample! How Can We Compute Estimated Standard Error? • Based on Constructing Distribution of Sample Mean Slide, Will Estimated Standard Error Be Smaller or Larger Than Sample Standard Deviation (s)? • Estimated Std. Error ______ than s.
For Federal Aid Study Estimated Standard Error Expression
Confidence Factor for MOE: Appendix 5 Can Use t-Table Provided Distribution of Sample Mean is Normal
Interpretation of Confidence Interval • 95% Confident that Interval $7,983 + $280 Contains Unknown Population (Not Sample) Mean Income. • If We Selected 1,000 Samples of Size 12 and Constructed 1,000 Confidence Intervals, about 950 Would Contain Unknown Population Mean and 50 Would Not. • So Is Tract Eligible for Aid???
Would Tract Be Eligible? • Situation A: 7,700+ 150 • Situation B: 8,250+ 150 • Situation C: 8,050+ 150
Width versus Meaningfulness of Two-Sided Confidence Intervals Ideal: _________ Level of Confidence and _________ Confidence Interval . How Obtain?
Chapter Summary • Why Must We Estimate Population Mean? • Why Would You Want to Reduce MOE? • How Can MOE Be Reduced Without Lowering Confidence Level?