Download

1 / 8
80 likes | 97 Views
Learn about inference for population mean using point estimates, standard error, t-distributions, and confidence intervals. Understand the properties of t-distributions and how to perform one-sample t-tests.

E N D
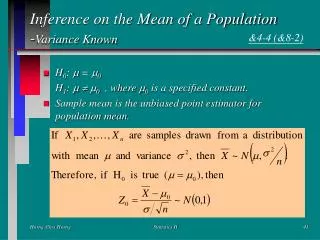
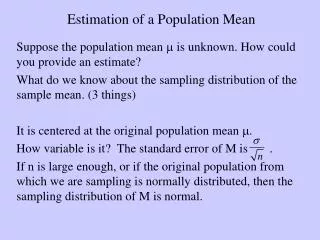
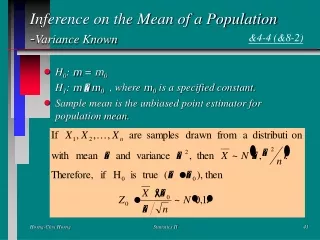
Inference for • The goal is to make inference about • is a point estimate of . • If we sample from a normal distribution, the sampling distribution of is standard normal. • If we sample from a non-normal distribution, the sampling distribution above is approximately standard normal for large n.
Standard Error • is seldom known • Estimate by S • When the standard deviation of a statistic is estimated from the data, the result is called the standard error of a statistic. The standard error of the sample mean is
The t Distributions • Suppose that an SRS of size n is drawn from a population. Then the one-sample t statistic has the t distribution with n – 1 degrees of freedom. • The assumption that we sample from a normal population is important for small n, but not for large n.
Properties of the t Distribution • continuous and symmetric about 0 • more variable and slightly different shape than standard normal (see Figure page 494) • There are an infinite number of t distributions. They are indexed by the number of degrees of freedom. • As the number of degrees of freedom increase, the t distribution approaches the standard normal.
The One-Sample t Confidence Interval • Suppose that an SRS of size n is drawn from a population having unknown mean . A level C confidence interval for is • Where t* is the value for t(n – 1) density curve with area C between –t* and t*. This interval is exact when the population distribution is normal and is approximately correct for large n in other cases.
Margin of Error • The margin of error for the population mean when we use the data to estimate is
The One-Sample t Test • Suppose that an SRS of size n is drawn from a population having unknown mean . To test the hypothesis Ho: based on an SRS of size n, compute the one-sample t statistic