Slide Note
0 likes | 10 Views
The Phillips Curve, formulated by A.W. Phillips in 1958, illustrates the inverse link between inflation and unemployment. It shows that when unemployment is low, wages rise, leading to inflation, and vice versa. Policymakers use this trade-off to balance inflation and unemployment rates. The curve highlights the trade-offs between inflation and unemployment and the policy implications of choosing a specific inflation rate in relation to unemployment. The curve's stability aids in decision-making to achieve optimal inflation-unemployment combinations.

E N D
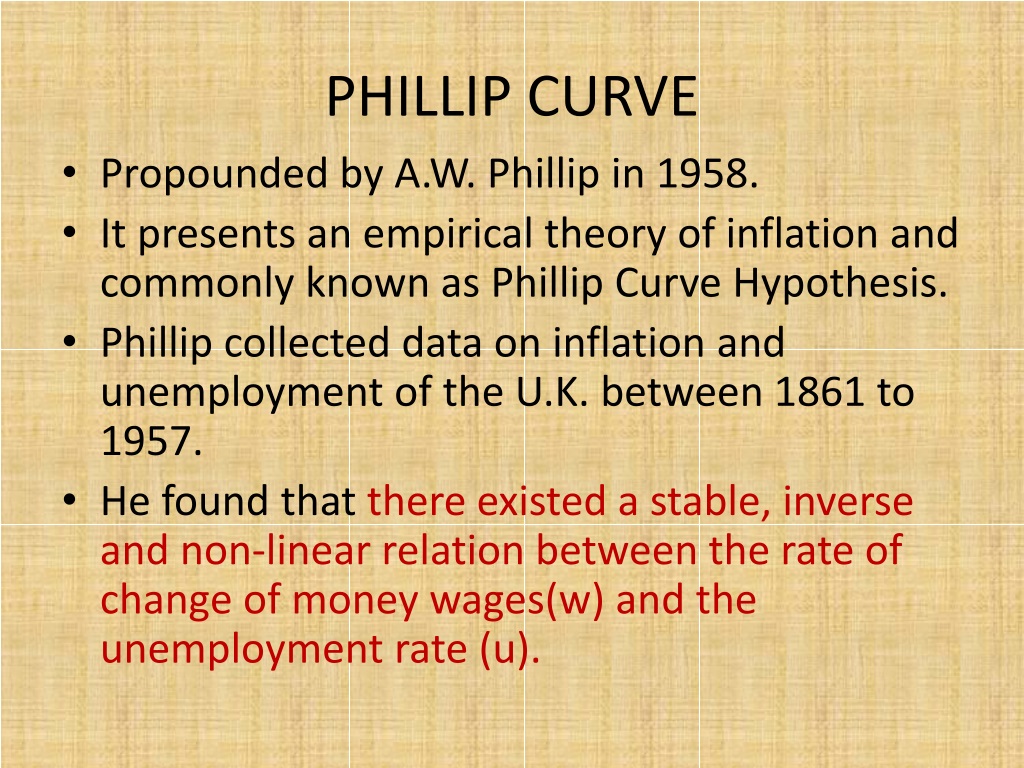
PHILLIP CURVE • Propounded by A.W. Phillip in 1958. • It presents an empirical theory of inflation and commonly known as Phillip Curve Hypothesis. • Phillip collected data on inflation and unemployment of the U.K. between 1861 to 1957. • He found that there existed a stable, inverse and non-linear relation between the rate of change of money wages(w) and the unemployment rate (u).
• In other words when unemployment is low, wages will rise and • When unemployment is high wages will fall, but the fall in wages will fall slowly as there is downward rigidity of wage rate. • The curve obtained from the inverse relationship between inflation and unemployment is called PHILLIP CURVE.
• At an unemployment level of U2 , wage inflation is W2. If unemployment declines to U3,wage inflation rises to W3 and when unemployment reaches to W1 wage inflation falls to U1. W3 Wage inflation Price inflation W W2 W1 W U P 0 W U2 U1 U3 Unemployment rate W
• The Phillip curve is convex to the origin which indicates that successive unemployment leads to progressively greater increase in wage inflation. • Similarly to reduce wage inflation to zero requires high level of employment U0. • In the period of low unemployment , excess demand for labour exists and labour scarcity pushes money wages upward. • Śimilarly in times of high unemployment, excess supply of labour exists and the surplus labour drives the money wages downward. reduction in
PHILLIP CURVE AND POLICY IMPLICATION • The economist and policy makers interpreted Phillip Curve as a trade off between price inflation and unemployment. • It expresses inverse relationship between the rate of price inflation and the rate of unemployment. • A stable Phillip cure enables the policy makers to choose a given rate inflation) and bear the cost of necessary rate of inflation(or unemployment). • It implies Less inflation can be had only at the cost of higher unemployment unemployment can be had at the cost of higher inflation. of unemployment(or and lower
WW is the original Phillip Curve. It shows the relationship between unemployment and wage inflation. PP is the new Phillip curve which shows the relationship between price inflation and unemployment. PP is drawn on the assumption that Wage inflation P W the rate of price inflation(P) is equal to the difference the rate of growth of money wages(W) and the rate of Price inflation Productivity 3 W P 0 5 Unemployment Curve labour productivity(X) i.e. P= W-X . Here it is assumed that the rate of growth of labour productivity is (x) is 3 percent per annum. Thus on PP curve 0 rate of price inflation
require 5 % rate of unemployment in the economy. Lower unemployment can only be achieved at a positive rate of inflation. • The optimum inflation- unemployment combination can be analysed with the help of indifference curve. Assumptions- • Policy makers are ready accept some increase in inflation for a reduction in unemployment rate. • Indifference cure between inflation and unemployment represent preference function. •
• Both inflation and unemployment are undesirable therefore IC are cocave towards the origin. • Higher utility is achieved moving towards the lower IC.
• Optimum inflation-unemployment combination is achieved at the point A where IC2 is tangent to PP. If the initial position of PP were R …………..(where PP cuts the x axis) , the reduction of the unemployment rate is optimum at U0 is achived at the cost of P0 inflation. P IC1 Price inflation IC2 IC3 A P0 P 0 U0 Unemployment rate R
Slope and position of Phillip Curve • Stable Phillip curve indicates a permanent decrease in unemployment permanent increase in the rate of inflation. • In case of flatter Phillip curve rate of decrease in unemployment is more than the rate of increase in inflation. • If the slopes of Phillip curve are the same, the Phillip curve nearer to the origin is preferred. rate for a