Download
1 / 18
180 likes | 276 Views
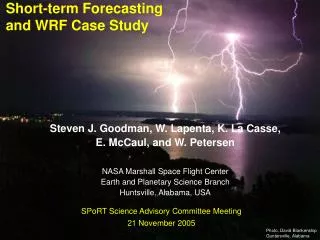
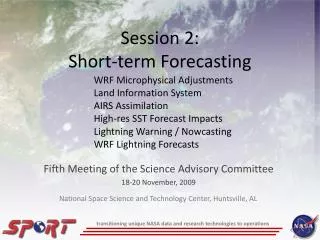
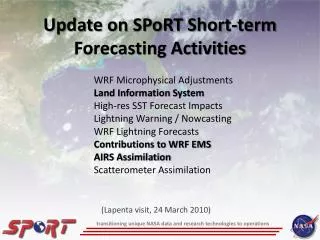
WRF Microphysical Adjustments Land Information System High-res SST Forecast Impacts Lightning Warning / Nowcasting WRF Lightning Forecasts Contributions to WRF EMS AIRS Assimilation Scatterometer Assimilation. Update on SPoRT Short-term Forecasting Activities.

E N D
WRF Microphysical Adjustments Land Information System High-res SST Forecast Impacts Lightning Warning / Nowcasting WRF Lightning Forecasts Contributions to WRF EMS AIRS Assimilation Scatterometer Assimilation Update on SPoRT Short-term Forecasting Activities (Lapenta visit, 24 March 2010) transitioning unique NASA data and research technologies to operations
Land Surface Modeling with LIS • Precip Verification Study over SE U.S. • LIS land surface initialization vs. interpolated NAM • Application of non-standard verification methods • Real-time LIS/Noah at SPoRT • Output to initialize WRF EMS runs • Diagnostics for NWS BHM CI study • Incorporate MODIS veg compositesinto LIS (underway) transitioning unique NASA data and research technologies to operations
10 Jun 2008 Sensitivity Example0-10 cm soil moisture SST Differences transitioning unique NASA data and research technologies to operations
10 Jun 2008: 1224 hour forecastsSensible Heat Flux 1-hour Precipitation LISMOD CNTL DIFF Stage IV transitioning unique NASA data and research technologies to operations
10 Jun: MODE 10-mm/(1 h) Precip Objects Matched Forecast Objects (“hits”) Control LISMOD Matched Observed Objects transitioning unique NASA data and research technologies to operations
10 Jun: MODE 10-mm/(1 h) Precip Objects Un-matched Forecast Objects (false alarms) Control LISMOD Un-matched Observed Objects (misses) transitioning unique NASA data and research technologies to operations
10 Jun: MODE 10-mm/(1 h) Precip Objects Control LISMOD transitioning unique NASA data and research technologies to operations
MET/MODE 1-h Precip Object Verification:(Un-)Matched Differences by Model Run, 1224 h Forecasts transitioning unique NASA data and research technologies to operations
Real-time LIS/Noah at SPoRT • 3-km LIS over southeast U.S. • Spin-up run; restarts 4x per day • Hourly output posted to ftp site • LIS output for diagnostics • Readily displayable in AWIPS II • NWS BHM: Convective initiation • Other short-term forecasting issues (low temps, fire weather, etc.) • Future plans • Expand 3-km to near CONUS • 1-km high-res nest for BHM CI study transitioning unique NASA data and research technologies to operations
Contributions to the WRF EMS v3.1 NOAA/GLERL Ice Mask Super Tuesday Tornado outbreak transitioning unique NASA data and research technologies to operations • SPoRT datasets for initializing the WRFEnvironmental Modeling System (EMS) • High-res, 1-km enhanced SSTs (MODIS+AMSR-E) • Great Lakes sea ice mask • LIS 3-km land surface initialization fields • Experimental output fields (Dembek – ARW core) • Max output interval base reflectivity • Max output interval 10-m wind speed • Max output interval updraft helicity • Max output interval updraft/downdraft speed • McCaul’s Forecast lightning threats*(implemented only into NSSL/WRF)
Improved Initial 2-m Temp in WRF EMS (NMM) using SPoRT SSTs and Land Surface fields LAPS/NAM transitioning unique NASA data and research technologies to operations
Improved Initial 2-m Temp in WRF EMS (NMM) using SPoRT SSTs and Land Surface fields LAPS + SPoRT SSTs transitioning unique NASA data and research technologies to operations
Improved Initial 2-m Temp in WRF EMS (NMM) using SPoRT SSTs and Land Surface fields LAPS + SPoRT SSTs + LIS Tskin transitioning unique NASA data and research technologies to operations
Methodology for Profile Assimilation AIRS QI’s for 17 Jan 2007 • L2 Version 5 temperature and moisture profiles • 28-level standard product • Land and water soundings w/ separate errors • Quality control using Pbest value in each profile • Sensitivity study assimilating only AIRS profiles Current Analysis Error Characteristics BKGD AIRS water AIRS land • WRF-Var from NCAR • B-matrix from “gen_be” • WRF initialized with 40-km NAM at 0000 UTC (cold start) • 12-km analysis and model grid • Short WRF forecast used as background for analysis transitioning unique NASA data and research technologies to operations
Profile Precipitation Verification • Combined forecast results for 12-48 hr forecasts of precipitation for 37-days from winter 2007 • Equitable Threat Score shows forecasted and observed precipitation matches • Improvement at all thresholds except lightest • Best results for moderate thresholds (28% at 12.7 mm/6h, 14% at 19.05 mm/6h, 90% at 25.40) • Bias score shows F/O • Improved (closer to 1) for all thresholds transitioning unique NASA data and research technologies to operations
12-13 February 2007 Case 2/12/07 1200Z Surface Analysis 2/13/07 1200Z Surface Analysis Developing front draped across Texas 2/12/07 0742-0800Z AIRS 2/12/07 0800Z GOES IR Image High-quality AIRS profiles in clear skies ahead of front Pressure (hPa)
3DVAR Analysis Modification Gulf of Mexico soundings at ≈08 UTC on 12 February 2007 • Figure at right shows how assimilation of AIRS temperature and moisture profile impacts a sample Skew-T • Warms near-surface; cools upper levels • Result is a more unstable sounding • Entire column is moistened Mid-level cooling Low-level warming BKGD AIRS ALYS Pressure (hPa) transitioning unique NASA data and research technologies to operations
Improved Precipitation Forecasts Control Control + AIRS Analysis “Truth” 24-h forecast valid 00Z 2/13/07 • Convective precipitation in Eastern Texas • Control (upper left) produces some rain but does not capture significant precipitation • AIRS (upper middle) reproduces convective precipitation line • Better representation of lower level moisture • CAPE values above 1800 J/kg in NAM analysis (lower right) • AIRS (lower middle) nicely represents CAPE • Control run (lower left) gives no hint of higher CAPE values 50.80 38.10 25.40 19.05 6-hr precip. 12.70 6.35 2.54 0.25 1000 hPa Td CAPE transitioning unique NASA data and research technologies to operations