Protein Mutational Analysis Using Statistical Geometry Methods
Protein Mutational Analysis Using Statistical Geometry Methods. Majid Masso mmasso@gmu.edu http://mason.gmu.edu/~mmasso Bioinformatics and Computational Biology George Mason University. Protein Basics. formed by linearly linking amino acid residues (aa’s are the building blocks of proteins)


Protein Mutational Analysis Using Statistical Geometry Methods
E N D
Presentation Transcript
Protein Mutational Analysis Using Statistical Geometry Methods Majid Masso mmasso@gmu.edu http://mason.gmu.edu/~mmasso Bioinformatics and Computational Biology George Mason University
Protein Basics • formed by linearly linking amino acid residues (aa’s are the building blocks of proteins) • 20 distinct aa types • A,C,D,E,F,G,H,I,K,L,M,N,P,Q,R,S,T,V,W,Y
Amino Acid Groups • Brandon/Tooze (affinity for water) • hydrophobic aa’s: A,V,L,I,M,P,F • hydrophilic aa’s: • polar: N,Q,W,S,T,G,C,H,Y • charged: D,E,R,K • Dayhoff (similar wrt structure or function) • (A,S,T,G,P),(V,L,I,M),(R,K,H),(D,E,N,Q),(F,Y,W),(C) • conservative substitution: replacement with an amino acid from within the same class • non-conservative substitution: interclass replacement
Protein Basics • genes: code, or “blueprint” • proteins: product, or “building” • protein structure gives rise to function • why do “things go wrong”? • mistakes in “blueprint” • incorrectly built, or nonexistent “buildings” • Protein Data Bank (PDB): repository of protein structural data, including 3D coords. of all atoms (www.rcsb.org/pdb/) PDB ID: 1REZ Structure reference: Muraki M., Harata K., Sugita N., Sato K., Origin of carbohydrate recognition specificity of human lysozyme revealed by affinity labeling, Biochemistry 35 (1996)
Computational Geometry Approach to Protein Structure Prediction Tessellation • protein structure represented as a set of points in 3D, using Cα coordinates • Voronoi tessellation: convex polyhedra, each contains one Cα , all interior points closer to this Cα than any other • Delaunay tessellation: connect four Cα whose Voronoi polyhedra meet at a common vertex • vertices of Delaunay simplices objectively define a set of four nearest-neighbor residues (quadruplets) • 5 classes of Delaunay simplices • Quickhull algorithm (qhull program), Barber et al., UMN Geometry Center Voronoi/Delaunay tessellation in 2D space. Voronoi tessellation-dashed line, Delaunay tessellation-solid line (Adapted from Singh R.K., et al. J. Comput. Biol., 1996, 3, 213-222.) Five classes of Delaunay simplices. (Adapted from Singh R.K., et al. J. Comput. Biol., 1996, 3, 213-222.)
Counting Quadruplets • assuming order independence among residues comprising Delaunay simplices, the maximum number of all possible combinations of quadruplets forming such simplices is 8855
Residue Environment Scores • log-likelihood: • = normalized frequency of quadruplets containing residues i,j,k,l in a representative training set of high-resolution protein structures with low primary sequence identity • i.e., = total number of quadruplets in dataset containing only residues i,j,k,l divided by total number of observed quadruplets • = frequency of random occurrence of the quadruplet (multinomial) • i.e., • = total number of occurrences of residue i divided by total number of residues in the dataset • , where n = number of distinct residue types in the quadruplet, and t i is the number of residues of type i.
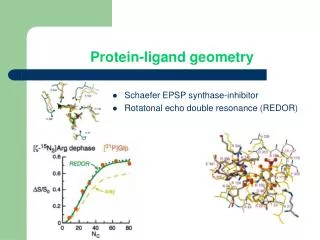
Residue Environment Scores • total statistical potential (topological score) of protein: sum the log-likelihoods of all quadruplets forming the Delaunay simplices • individual residue potentials: sum the log-likelihoods of all quadruplets in which the residue participates (yields a 3D-1D potential profile) PDB ID: 3phvHIV-1 Protease Monomer 99 amino acids (total potential 27.93) Structure reference: R. Lapatto, T. Blundell, A. Hemmings, et al., X-ray analysis of HIV-1 proteinase at 2.7 Å resolution confirms structural homology among retroviral enzymes, Nature 342 (1989) 299-302.
Properties of HIV-1 Protease • functional as a homodimer • 99 residues per subunit • monomers form an intermolecular two-fold axis of symmetry • approximate intramolecular two-fold axis of symmetry • dimer interface: N and C termini (P1-T4 & C95-F99, respectively) form a four-stranded beta sheet • active site triad: D25-T26-G27 • h-phobic flaps (M46-V56) are also G-rich, providing flexibility • accommodate / interact with substrate molecule Figure adapted from URL: http://mcl1.ncifcrf.gov/hivdb/Informative/Facts/facts.html
HIV-1 Protease Comprehensive Mutational Profile (CMP) • mutate 19 times the residue present at each of the 99 positions in the primary sequence • get total potential and potential profile of each artificially created mutant protein • create 20x99 matrix containing total potentials of all the single residue mutants • columns labeled with residues in the primary sequence of wild-type (WT) HIV-1 protease monomer, and rows labeled with the 20 naturally occurring amino acids • subtract WT total potential (TP) from each cell, then average columns to get CMP • CMPj = [(mutant TP)ij-(WT TP)] = [(mutant TP)ij-27.93] , j=1,…,99
Mean Change in Total Protein Potential Residue
Experimental Data • 536 single point missense mutations • 336 published mutants: Loeb D.D., Swanstrom R., Everitt L., Manchester M., Stamper S.E., Hutchison III C.A. Complete mutagenesis of the HIV-1 protease. Nature, 1989, 340, 397-400 • 200 mutants provided by R. Swanstrom (UNC) • each mutant placed in one of 3 phenotypic categories, positive, negative, or intermediate, based on activity • mutant activity to be compared with change in sequence-structure compatibility elucidated by potential data
Observations • set of mutants with unaffected protease activity exhibit minimal (negative) change in potential • set of mutants that inactivate protease exhibit large negative change in potential, weighted heavily by NC • set of mutants with intermediate phenotypes exhibit moderate negative change in potential (similar among C and NC); wide range for intermediate phenotype in the experiments
Apply chi-square test statistic on tables above, with the null hypothesis being no association between residue position conservation and level of sensitivity to mutation : • LHS table (1 df): χ2 = 10.44, reject null with p < 0.01 • RHS table (2 df): χ2 = 75.49, reject null with p < 0.001
Mutagenesis at the Dimer Interface • Q2, T4, T96, and N98 are polar and side chains directed outward; P1, I3, L97, and F99 are hydrophobic and side chains directed toward body • F99 in one subunit makes extensive contacts with I3, V11, L24, I66, C67, I93, C95, and H96 in the complementary chain
Mutagenesis at the Dimer Interface • Alanine scan conducted on interface residues individually and in pairs, in one subunit and in both chains; activity of mutants measured by % cleavage of β-galactosidase containing a protease cleavage site • S. Choudhury, L. Everitt, S.C. Pettit, A.H. Kaplan, Mutagenesis of the dimer interface residues of tethered and untethered HIV-1 protease result in differential activity and suggest multiple mechanisms of compensation, Virology 307 (2003) 204-212. • Results: Good correlation between % cleavage (protease activity) and topological scores (protease sequence-structure compatibility)
Conformational Changes Due to Dimerization and/or Ligand Binding PDB ID: 1g35 HIV-1 Protease Dimer with Inhibitor aha024 monomer in a dimeric configuration with an inhibitor: obtain profile for 1g35, plot 3D-1D only for g35A isolated monomer: eliminate all PDB coordinate lines in 1g35 except those for 1g35A, obtain profile, plot 3D-1D plot interface: difference between the 1g35A 3D-1D’s in the dimer and monomer configurations Structure reference: W. Schaal, A. Karlsson, G. Ahlsen, et al., Synthesis and comparative molecular field analysis (CoMFA) of symmetric and nonsymmetric cyclic sulfamide HIV-1 protease inhibitors, J. Med. Chem. 44 (2001) 155-169
Observations • majority of residues forming both dimer interface and flap region exhibit increase in stability following dimerization: Q2, T4, I47-I54, T96, L97, and F99 • all h-phobic except Q2 • increase in stability due to inhibitor binding evident for the active site residues D25, T26, and G27; also true for the surrounding h-phobic residues L24 and A28
Significance of Hydrophobic Residues in HIV-1 Protease • 35/99 amino acids with scores exceeding 1.0 • 27 of these are hydrophobic • altogether, 44/99 amino acids in protease are hydrophobic • Assuming h-phobic residues no more likely than others (polar/charged) to have score>1.0 • expect (35/99)x44, i.e. 15 or 16 h-phobics >1.0 • P(27 h-phobics>1.0)= < 0.001, yet this is exactly what we observe! • What about other cut-off scores, and other proteins? • applied similar test to all 996 proteins in the training set—while varying cut-off between 0.0-5.0 in 0.25 increments, binomial probabilities were calculated for each protein. For a given p-value, # of proteins with a lower significance level at each cut-off score was tabulated
Significance of Hydrophobic Residues • optimal cut-off score for rejection of the null is clearly distinct for each of the individual proteins. • Ex. 827 proteins reject a null with 2.0 cut-off score at p = 0.05, but 918 proteins reject the null at the same significance level if all cut-off scores considered. • alternate approach: 92,343 h-phobic amino acids and 136,329 others (polar/charged), total of 228,672 residues in the 996 proteins; assuming no differ. in the mean of the scores in both groups, apply t-test. • Result: t=126.48, with 228,670 df => reject null!
Acknowledgements • Iosif Vaisman (Ph.D. advisor, first to apply Delaunay to protein structure) • Zhibin Lu (Java programs for calculating statistical potentials from tessellations) • Ronald Swanstrom (experimental HIV-1 protease mutants and activity measure)