Download
1 / 2
20 likes | 145 Views
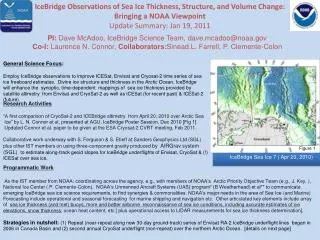
PI: Dave McAdoo, IceBridge Science Team, dave.mcadoo@noaa.gov Co-I: Laurence N. Connor, Collaborators: Sinead.L. Farrell, P. Clemente-Colon. General Science Focus :

E N D
PI: Dave McAdoo, IceBridge Science Team, dave.mcadoo@noaa.gov Co-I: Laurence N. Connor, Collaborators:Sinead.L. Farrell, P. Clemente-Colon General Science Focus: Employ IceBridge observations to improve ICESat, Envisat and Cryosat-2 time series of sea ice freeboard estimates. Divine ice structure and thickness in the Arctic Ocean. IceBridge will enhance the synoptic, time-dependent mappings of sea ice thickness provided by satellite altimetry from Envisat and CryoSat-2 as well as ICESat (for recent past) & ICESat-2 (future) IceBridge Observations of Sea Ice Thickness, Structure, and Volume Change: Bringing a NOAA ViewpointUpdate Summary: Jan 19, 2011 Research Activities “A first comparison of CryoSat-2 and ICEBridge altimetry from April 20, 2010 over Arctic Sea Ice” by L. N. Connor et al, presented at AGU, IceBridge Poster Session, Dec 2010 [Fig 1] Updated Connor et al. paper to be given at the ESA Cryosat-2 CVRT meeting, Feb 2011. Collaborative work underway with S. Ferguson & S. Etieff at Sanders Geophysics Ltd (SGL) plus other IST members on using three-component gravity produced by AIRGrav system (SGL) to estimate along-track geoid slopes for IceBridge underflights of Envisat, CryoSat & (!) ICESat over sea ice. Figure 1 IceBridge Sea Ice 7 ( Apr 20, 2010) Programmatic Work As the IST member from NOAA: coordinating across the agency, e.g., with members of NOAA’s Arctic Priority Objective Team (e.g., J. Key, ), National Ice Center ( P. Clemente-Colon), NOAA’s Unmanned Aircraft Systems (UAS) program* (B Weatherhead) et al** to communicate emerging IceBridge sea ice science requirements, to find synergies & commonalities. NOAA’s major needs in the area of Sea Ice (and Marine) Forecasting include operational and seasonal forecasting for marine shipping and navigation etc. Other articulated key elements include array of sea ice thickness (and met) buoys, more and better airborne reconnaissance of sea ice conditions, including accurate estimates of ice elevations, snow thickness; ocean heat content, etc [ plus operational access to LIDAR measurements for sea ice thickness determination]. Strategies in nutshell: (1) Repeat (near-repeat along new 30-day ground-track) series of Envisat RA-2 IceBridge underflight lines began in 2006 in Canada Basin and (2) second annual CryoSat underflight (non-repeat) over the northern Arctic Ocean. [details on next page]
McAdoo – cont’d • Strategy Specifics for 2011: • Repeat (or near-repeat) series of Envisat RA-2 IceBridge underflight lines began in 2006 in the eastern Canada Basin – “Sea Ice 6” in 2011 [see Fig 2] • (2) Continue annual (non- repeat?) time series of CryoSat-2 underflight obs begun with IceBridge observations of April 20, 2010- cf “Sea Ice 7” in 2010. [Fig 1 ] and use • CryoVex2011 for locating Icebridge 2011 Sea 7” • (3) Maintain similar annual repeat series along established ICESat lines in the Canada Basin (northern Beaufort Gyre region) and north of Greenland ( Sea Ice lines 1,2, 4 • and/or 5, 2011, ala John Sonntag circa 1/14/2011) • (4) Work with SGL personnel (S Ferguson et al) to reprocess IceBridge three-component AIRGrav gravity along lines in (1), (2) and (3) above to extract along-track geoid slopes. Figure 2 OIB AIRGrav Gravity Anomalies (Vertical, not geoid slope) Apr 5, 2010 along Sea Ice 6 line Envisat RA-2 & ATM freeboard Mar 2006 - along Sea Ice 6 line Mean difference between out (red) & back (blue) AIRGrav passes is is .54 mGal AND Std dev is 0.55mGal. Connor et al, RSE 2009