Download
1 / 11
110 likes | 224 Views
APPLICATION OF SATELLITE RADAR INTERFEROMETRY ON THE AREAS OF UNDERGROUND EXPLOITATION OF COPPER ORE IN LGOM - POLAND. ZASTOSOWANIE SATELITARNEJ INTERFEROMETRII RADAROWEJ NA TERENACH EKSPLOATACJI RUD MIEDZI W LGOM.

E N D
APPLICATION OF SATELLITE RADAR INTERFEROMETRY ON THE AREAS OF UNDERGROUND EXPLOITATION OF COPPER ORE IN LGOM - POLAND ZASTOSOWANIE SATELITARNEJ INTERFEROMETRII RADAROWEJ NA TERENACH EKSPLOATACJI RUD MIEDZI W LGOM Artur Krawczyk Department of Mining Area's Protection, University of Mining and Metallurgy Zbigniew Perski Department of Geological Mapping, University of Silesia
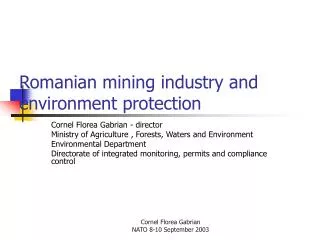
The area of research In the region of Legnica - Głogów Copper Region there are: • 7 mining areas • 3 underground mines • Total mining areas occupy about 400 km2 • There are 2 towns: Lubin and Polkowice, both with protection pillars • There are 2 post-flotation settling ponds
Mining exploitation system: room - pillar exploitation system with the fall of roof Size of a land subsidence: average - from 2000 to 2600 mm (Popiołek, 1998) Rate of the land subsidences over the fall of roof exploitation: not exceed 1,25 mm/twenty – four hours maximal rate 2,5 mm/twenty – four hours (Ostrowski & others, 1996) The mining exploitation
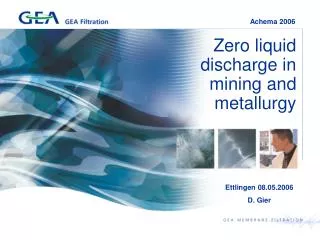
The method of measurment is ... SAR (Synthetic Aperture Radar) images acquired by ERS-1 satellite (European Remote-Sensing Satellite) The received signal, is formed into SAR image – the radarogram. The digital SAR image contains two informations: 1. information about the power of backscattered signal - intensity 2. the phase of the received signal In our research we are using phase information Picture from http://www-star.stanford.edu/sar_group/
Radar interferometry After processing interferometric phase is represented on interferogram by the sets of colors called inteferometric fringes. We take two radarograms taken 10.01.1994 and 11.03.1994 Differential phase processing
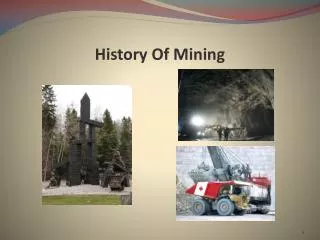
The interferogram ERS SAR Interferogram of LGOM area presents configuration of dynamic subsidence troughs. The numbers presenting the locations of identified subsidence troughs
95 Subsidence throw 12
Conclusions • 1. For the interpretation of the all area LGOM presently enough is getting 1/4 of the frame of ERS SAR image. • 2. Observed 24 dynamical slopes of the subsidence troughs, which rised is directly connected with leading exploitation of the last quarter 1993 and the first quarter of 1994 • 3.The all observed subsidence troughs are suitable for the further interpretation. • 4.The observed subsidence troughs over the exploitation area, where is used fall of roof system, during 2 month reached a maximal value approximately 110 mm/60days • 5. Rate of the land subsidences over the fall of roof exploitation was 1,83 mm/twenty – four hours and didn't exceed an anticipated maximal value 2,5 mm/twenty – four hours.
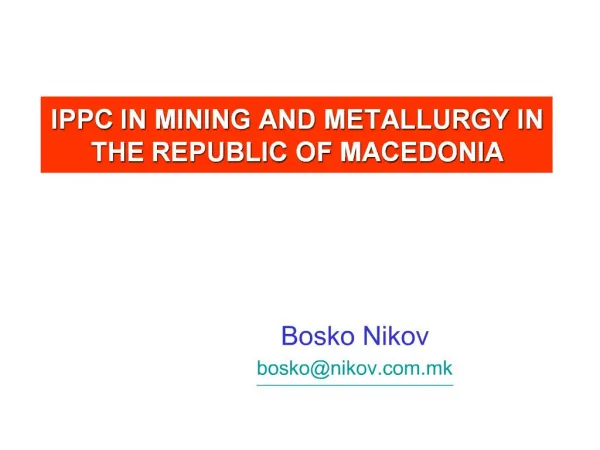
Survey traverses Comparing location of two months land subsidences to survey traverses