Download
1 / 49
490 likes | 777 Views
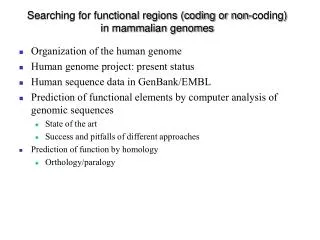
Searching for functional regions (coding or non-coding) in mammalian genomes. Organization of the human genome Human genome project: present status Human sequence data in GenBank/EMBL Prediction of functional elements by computer analysis of genomic sequences State of the art

E N D
Searching for functional regions (coding or non-coding) in mammalian genomes • Organization of the human genome • Human genome project: present status • Human sequence data in GenBank/EMBL • Prediction of functional elements by computer analysis of genomic sequences • State of the art • Success and pitfalls of different approaches • Prediction of function by homology • Orthology/paralogy
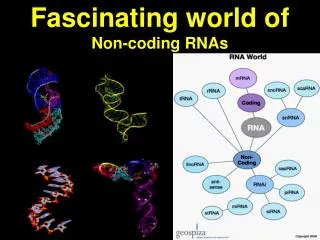
Functional elements in the human genome Untranslated RNAs: Xist, H19, His-1, bic, etc. Regulatory elements: promoters, enhancers, etc. Repeated sequences (SINES, LINES, HERV, etc.) : 40% of the human genome
Repeat Sequences • Tandem repeats • motif bloc size % human genome • satellite: 2-2000 nt up to 10 Mb 10% • minisatellite: 2-64 nt 100-20,000 bp ? • microsatellite: 1-6 nt 10-100 bp 2% • Interspersed repeats • SINE (non-autonomous retroelement) • LINE (retrotransposon) • Endogenous Retrovirus (HERV, LTR- retrotransposon) • DNA transposons
Fréquence des éléments transposables dans le génome humain • Total = 42% (Smit 1999)
Retropseudogènes • 23,000 à 33,000 retropseudogènes dans le génome humain (6-10 copies / Mb) • Les gènes qui génèrent des retropseudogènes sont généralement de type housekeeping • Gonçalves et al. 2000
Structure of human protein genes • 1396 complete human genes (exons + introns) from GenBank • Average size (25%, 75%) • Gene 15 kb ± 23 kb (4, 16) (10% > 35 kb) • CDS 1300 nt ± 1200 (600, 1500) • Exon (coding) 200 nt ± 180 (110, 200) • Intron 1800 nt ± 3000 (500, 2000) • 5'UTR 210 nt (Pesole et al. 1999) • 3'UTR 740 nt (Pesole et al. 1999) • Intron/exon • Number of introns: 6 ±3 introns / kb CDS • Introns / (introns + CDS): 80% • 5' introns in 15% of genes (more ?), 3 ’introns very rare • Alternative splicing in more than 30% of human genes (Hanke et al. 1999)
Structure of human protein genes • GenBank: bias towards short genes • 1396 complete human genes (exons + introns)
Structure of human protein genes • GenBank: bias towards short genes • 1396 complete human genes (exons + introns) • 9268 complete human mRNA
Isochore organization of the human genome • Insertion of repeated sequences (A. Smit 1996) • Recombination frequency (Eyre-Walker 1993) • Chromosome banding (Saccone, 1993) • Replication timing (Bernardi, 1998) • Gene density (Mouchiroud, 1991) • Gene expression ?? -> No • Gene structure (Duret, 1995)
Isochores and insertion of repeat sequences 4419 human genomic sequences > 50 kb
Isochores and gene density MHC locus (3.6 Mb) (The MHC sequencing consortium 1999) Class I, class II (H1-H2 isochores): 20 genes/Mb, many pseudogenes Class III (H3 isochore): 84 genes/Mb, no pseudogene Class II boundaries correlate with switching of replication timing
Isochores and introns length Duret, Mouchiroud and Gautier, 1995 • 760 complete human genes • L1L2: intron G+C content < 46% • H1H2: intron G+C content 46-54% • H3: intron G+C content >54%
Expressed Sequence Tags (ESTs) • Inventory of all mRNAs expressed by an organism, in different tissues, development stages, pathologies, … • Single pass sequences: high error rate (>1%), partial mRNA sequences • Usually derived from poly-dT-primed cDNA -> bad coverage of 5' regions of long mRNAs • 60-80% of human genes represented in public EST database, but only 25-50% of the total coding part of the genome Number of ESTs (Sep. 2000) • Homo sapiens 2,461,893 • Mus musculus (mouse) 1,661,949 • Rattus sp. (rat) 188,736
Genomic Sequences (draft)
Exponential growth of sequence data • Doubling time: 13 mounths Publicly available sequences (Mb)
Human Genome Sequence Data • Traditional sequences: correspond to biologically characterized genes, annotated by reearchers or database curators, usually relatively short (<20,000). • Finished genome sequences: long contiguous sequences, correspond to clones (cosmid, BAC, PAC); partly automatically generated annotations covers repetitive elements, kown and predicted genes, EST matches • Unfinished genome sequences (draft): large sequence entries consisting of unordered pieces separated by runs of N's, correspond to clones, contain minimal annotation. • Genome survey sequences: low-quality, single pass sequences from a variety of different projects (BAC end sequencing, polymorphism studies, CpG islands, etc.), minimal annotation.
Different types of nucleotide sequences in current databases
GenBank release 119 (September 28, 2000) Division Entries Nucleotides % nt EST 5,843,794 2,337,244,350 23% HTG 77,960 4,373,497,668 44% GSS 1,724,845 951,450,849 9% PRI 135,144 1,073,472,484 11% Other 882,631 1,296,473,741 13% Total 8,664,374 10,032,139,092 100% Human 3,518,824 6,253,704,359 62%
The human genome sequencing projectWhere are we today (July 17 2000) ? • According to Phillip Bucher (SIB, Lausanne) statistics and genome coverage estimates (see also EBI's statistics: http://www.ebi.ac.uk/~sterk/ genome-MOT)
Next steps in genome projects • Identify genes and other functional elements within genomic sequence (where are the genes ?) • Determine the function of genes (what do they do ?)
Prediction of functional elements (1) • Ab initio methods • Ruled-based or statistical methods • e.g.: protein genes prediction, promoter prediction, … • Very useful but ... • Limits in sensibility/specificity • No method available for many functional elements (non-coding RNA genes, regulatory elements, …)
Prédiction ab initio de gènes eucaryotes • Prédiction d ’exons codants • Recherche de phases ouvertes de lecture (ORF: open reading frame) • Taille moyenne des exons: ± 150 nt • Statistiques sur les nucléotides, usage des codons • Périodicité d'ordre 3, fréquence d ’hexamères • Modèles de Markov cachés • Signaux d ’épissage • Profils, modèles de Markov cachés, réseau neuronaux • Construction d ’un modèle de gène protéique • Combinaison d ’exons de phases compatibles (pondération en fonction des scores de chaque exon potentiel) • Recherche de limites de gènes • Exons terminaux (5 ’, 3 ’) • Promoteur • Signal de polyadénylation • Epissage alternatif ?? Exons non codants ?? Gène transcrits non codants (Xist, …) ??
Prédiction de gènes eucaryotes: qualité de la prédiction • Comparaison des différents logiciels: sensibilité/spécificité • Sn: sensibilité Sp: spécificité par exon (sn_e, sp_e) ou par nucéotide (sn_e, sp_e) • Jeu de données Burset-Guigo (1996): 570 gènes de vertébrés • Jeu de données Salamov et al (1998): 660 gènes humains
Prédiction de gènes eucaryotes: qualité de la prédiction • Comparaison des différents logiciels: sensibilité/spécificité • Sn: sensibilité Sp: spécificité par exon (sn_e, sp_e) ou par nucéotide (sn_e, sp_e) • Locus BRCA2 (1.4 Mb, chrom. 13q) (Sanger Centre 1999): région "difficile" pour les logiciels de prédiction. 159 exons
Prédiction de gènes protéiques complets • C. elegans: la plupart des ‘ gènes ’ annotés sont seulement des prédictions • Peut-on utiliser ces méthodes pour annoter les séquences génomique humaines ? • + les faux positifs !
Un peu d ’optimisme • Fraction de la longueur des gènes correctement prédits: 70-80% • Probabilité que deux exons potentiels consécutifs soient réels (et donc positifs en RT-PCR) 0.5
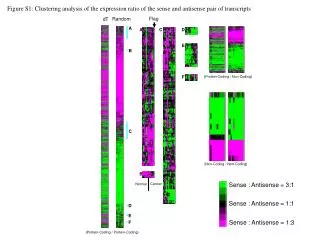
Prediction of functional elements (2) • Large scale transcriptome projects: ESTs, full-length cDNA • Identification of transcribed genes (protein or non-coding RNA) • Information on alternative splicing, polyadenylation (Hanke et al. 1999, Gautheret et al. 1998), expression pattern • SIM4: align a cDNA to genomic DNA • Very useful but ... • Problems with genes expressed at low level, narrow tissue distribution, stage-specific expression, … • Limited tissue sampling • Artifacts in ESTs (introns, partially matured RNA, …) • Limited to polyadenylated RNA
Prediction of functional elements (3) • Comparative sequence analysis (phylogenetic footprinting) • Function => selective pressure Corollary • Sequence conservation = selective pressure = function provided the number of aligned homologous sequences represents enough evolutionary time for the accumulation of mutations at the less constrained (presumably selectively neutral) base positions. • Evolutionary rate in non-functional DNA: ~ 0.3% / My (± 0.069) Man/Mouse: ~ 80 Myrs 46-58% identity Mammals/Birds: ~ 300 Myr 26-28% identity Random sequences 25% identity
Analyse comparative des gènes de b-actine de l'homme et de la carpe
Phylogenetic footprinting • Advantages • Works for all kinds of functional elements (transcribed or not, coding or not) as far as the information is in the primary sequence • Does not require any a priori knowledge of the functional elements • Limits • Absence of evolutionary conservation does not mean absence of function • No efficient method to detect unknown conserved secondary structure in RNA • Function, but what function ? • Depends on the sequencing status of other genomes • Human, mouse, fugu, C. elegans, drosophila, yeast, A. thaliana • Number of sequences to compare : > 200 Myrs of evolution • Mammals/birds: 310 Myrs • Human + mouse + bovine : 240 Myrs
Prédiction de gènes eucaryotes (suite) • Approche comparative • Comparaison d ’une séquence génomique avec des gènes déjà caractérisés dans d ’autres espèces (WISE2: alignement ADN/protéine avec épissage) • Comparaison de séquences génomiques (non-annotées) homologues • Locus mnd2 (homme souris) (Jang et al. 1999): >80 kb • Prédiction d ’exons internes basée sur la conservation de séquence ORF ≥ 80 nt Séquence protéique ≥ 70% similarité Séquence ADN ≥50% identité GT AG conservés => détection de tous les exons internes du gène D6Mm5e • Généralisation de la méthode (Guigo 2000). Sensibilité ? Spécificité ?
Next steps in genome projects • Identify genes and other functional elements within genomic sequence (where are the genes ?) • Determine the function of genes (what do they do ?)
Prédiction de fonction par homologie ? • Similarité entre séquences homologie • Homologie structure conservée • Structure conservée fonction conservée • Oui, mais … • Fonction: concept flou • activité biochimique identique ? e.g. même ligand pour un récepteur, même substrat pour une enzyme, même gènes cibles pour un facteur de transcription. • distribution tissulaire ? (isoformes tissu-spécifiques). • compartimentalisation cellulaire: cytoplasme, mitochondrie, etc. • Protéines homologues de fonction différentes • Protéines homologues ligands (activateur/répresseur) d ’un même récepteur • Recrutement pour une fonction totalement différente: t -cristalline / a-énolase • Orthologie/paralogie • Évolution modulaire
Prédiction de fonction par homologie ? MZEORFG: 1 ILNSPDRACNLAKQAFDEAISELDSLGEESYKDSTLIMQLLXDNLTLWTSDTNEDGGDE 59 I N+P++AC LAKQAFD+AI+ELD+L E+SYKDSTLIMQLL DNLTLWTSD ++ E BOV1433P: 186 IQNAPEQACLLAKQAFDDAIAELDTLNEDSYKDSTLIMQLLRDNLTLWTSDQQDEEAGE 244 Score = 87.4 bits (213), Expect = 1e-17 Identities = 41/59 (69%), Positives = 50/59 (84%) LOCUS BOV1433P 1696 bp mRNA MAM 26-APR-1993 DEFINITION Bovine brain-specific 14-3-3 protein eta chain mRNA, complete cds. ACCESSION J03868 LOCUS MZEORFG 187 bp mRNA PLN 31-MAY-1994 DEFINITION Zea mays putative brain specific 14-3-3 protein, tau protein homolog mRNA, partial cds.
Prédiction de régions régulatrices • Méthodes ab initio • Prédiction de promoteurs • Îlots CpG • Approche comparative
Large scale phylogenetic footprinting Non-coding sequences : 325,247 sequences 145 Mb everything except protein-coding regions and structural RNA genes (rRNA, tRNA, snRNA, scRNA) Introns, 5' and 3' untranslated regions, intergenic sequences Filtering of microsatellite repeats and cloning vectors: XBLAST Similarity search: BLASTN + LFASTA Vertebrates, insects, nematode
Sequence Similarities 1- Identification of new genes protein-genes, RNA-genes: intronicsnoRNA genes 2- Retroviral elements, retrotransposons 3- Low complexity sequences: GC-rich, AT-rich, cryptic microsatellites 4- Artefacts: annotation errors, sample contamination (sponge insulin, ascidian RNA, chicken TGFB1) 5- 326 highly conserved regions (HCRs) - do not code for proteins - do not correspond to any known structural RNA
326 Highly Conserved Regions (HCRs) • > 70% identity over 50 to 2000 nt after more than 300 Myrs • Unique sequences • Generally specific of only one gene • Longest HCR: 84% identity over 1930 nt after 300 Myrs 3’UTR deltaEF1 transcription factor • Oldest HCRs: 500 to 600 Myrs • No HCR between vertebrates and insects or nematode
Function of 3’HCRs:mRNA subcellular localization Myosin heavy chain, c-myc, vimentin, b-actin