Visualizing Data for Effective Decision-Making
Explore information visualization strategies to amplify cognition, discover patterns, and make data-driven decisions efficiently. Learn challenges, taxonomies, and tasks in designing interactive visual interfaces for universal usability.


Visualizing Data for Effective Decision-Making
E N D
Presentation Transcript
Designing the User Interface: Strategies for Effective Human-Computer Interaction Fifth Edition Ben Shneiderman & Catherine Plaisant in collaboration withMaxine S. Cohen and Steven M. Jacobs CHAPTER 14:Information Visualization
Introduction • “A Picture is worth a thousand words” • Information visualization can be defined as the use of interactive visual representations of abstract data to amplify cognition (Ware, 2008; Card et al., 1999). • The abstract characteristic of the data is what distinguishes information visualization from scientific visualization. • Information visualization: categorical variables and the discovery of patterns, trends, clusters, outliers, and gaps • Scientific visualization: continuous variables, volumes and surfaces • Information visualization provides compact graphical presentations and user interfaces for interactively manipulating large numbers of items, possibly extracted from far larger datasets.
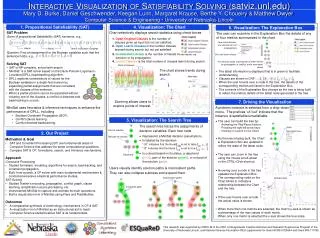
Introduction (cont.) • Sometimes called visual data mining, it uses the enormous visual bandwidth and the remarkable human perceptual system to enable users to make discoveries, take decisions, or propose explanations about patterns, groups of items, or individual items. • Visual-information-seeking mantra: • Overview first, zoom and filter, then details on demand. • Overview first, zoom and filter, then details on demand. • Overview first, zoom and filter, then details on demand. • Overview first, zoom and filter, then details on demand. • Overview first, zoom and filter, then details on demand.
Information Visualization • Introduction • Challenges for Information Visualization • Information is Beautiful • Interactive Information • Visualization of a million • Items
Challenges for Information Visualization (cont.) • Viewing large volumes of data
Data and Images of Taxonomy Taxonomy is 1. the science or technique of classification 2. the science dealing with the description, identification, naming, and classification of organisms
The seven basic tasks • Overview task - users can gain an overview of the entire collection • Zoom task - users can zoom in on items of interest • Filter task - users can filter out uninteresting items • Details-on-demand task - users can select an item or group to get details • Relate task - users can relate items or groups within the collection • History task - users can keep a history of actions to support undo, replay, and progressive refinement • Extract task - users can allow extraction of sub-collections and of the query parameters
Challenges for Information Visualization • Importing and cleaning data • Combining visual representations with textual labels • Finding related information • Viewing large volumes of data • Integrating data mining • Integrating with analytical reasoning techniques • Collaborating with others • Achieving universal usability • Evaluation
Challenges for Information Visualization (cont.) • Combining visual representations with textual labels
Challenges for Information Visualization (cont.) • Integrating with analytical reasoning techniques