Download
1 / 18
180 likes | 208 Views
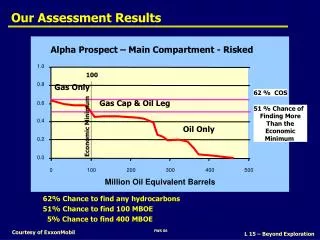
This assessment analyzes the economic effects of different scenarios on agricultural income, including compliance with cross-compliance standards. It examines the impacts on market effects, cost implications, and regional income effects.

E N D
Markus Kempen Economic Assessment Results
Outline Scenarios Definition Agricultural Income Effects Main Market Effects Overview on Cost Impacts Conclusion/Discussion Cross Compliance Assessment Tool
Analyzed Scenarios Main Scenarios: Baseline 2005: • Technically: CAPRI “base year” • All measures implemented in base period 2005-2009 • Compliance varies among SMR directives( GAEC issues and countries (70% - 100%); on average about ~90% • No implementation in Bulgaria and Romania • Violation of measures as estimated/observed in base year Zero Compliance: • Hypothetical situation without CC related measures • Mainly used as comparison scenario Compliance100pct: • Assuming full compliance with all measures Variations of Compliance100pct for Sensitivity Analysis: Cost200: cost doubled Cost500: cost increased by factor 5 Crops000Animals200: no cost for crops, animals doubled Crops200Animals000: no cost for animals, crops doubled Cross Compliance Assessment Tool
Income Effects (EU27) Cross Compliance Assessment Tool
Income Effects (EU27) Cross Compliance Assessment Tool
Income Effects – Sensitivity of Results Cross Compliance Assessment Tool
Regional Income Effects Cross Compliance Assessment Tool
Summary - Income • Minor effects comparing baseline situation (about 90% compliance) and full compliance (100%) • Cost related to CC standards are almost equal to drop in agricultural income • Agricultural Income decreases compared to a situation without regulation ( ~ -3%) • CC standards costare significantly lower than premium payments • No significant difference between crops and animal production ( … with respect to income) • Output value of animal products goes up with increasing cost (market effects can partially compensate) • Output value of crops slightly decreasing (at most stable) • Income drop homogeneous among regions [-5%, -1%] Cross Compliance Assessment Tool
Market effects for selected activities/products Cross Compliance Assessment Tool
Regional Production Effects LU per ha Cross Compliance Assessment Tool
Summary – Market/Production Effects Animals: • Overall decrease in herds; • Increasing prices almost compensate CC cost (… but not loss of production) • Decreases in prevailing intensive regions (… due cost related to manure application) • Dairy sector almost not affected (quota!) Crops: • Cereal production increasing (“best alternative”); • Cereal prices go down due decreasing (feed) demand and increasing acreage • Additional cereal production is processed to bio fuels (at lower prices) • “demanding” crops go down, costs can be partially compensated by price effects) Fallow Land: • Set aside and fallow land decrease (due GAEC enforcing minimum maintenance) • Assumptions on cost of fallow land are crucial! Cross Compliance Assessment Tool
Cost Implication at EU level Cross Compliance Assessment Tool
Regional Cost Implication Total cost per UAA Animal related cost per LU Crop related cost per UAA Nitrate Directive Animal Welfare Directive(s) Cross Compliance Assessment Tool
Summary - Cost Cost: • Animal production more affected then crops • Dir 4 (crops and animals) and Dir16-18 (only animals) major cost drivers • Significant regional difference in cost effects (especially for animals) Cross Compliance Assessment Tool
Conclusion/Discussion • CC Cost are not compensated by market effects • Divergent effects in Crop and animal sector • Public service payments might need to be targeted more strongly to livestock sectors (also in the light of important positive and negative externalities to environment by these sectors) • Maybe accompanying measure needed on maintenance of fallow land level? Cross Compliance Assessment Tool
Animal Welfare Minimum legal standard Minimum legal Standard Dairy cows Suckler cows Calves Pig fattening Estimated on farm condition Cross Compliance Assessment Tool
Animal Welfare Criteria Cross Compliance Assessment Tool
Summary – Animal Welfare • Based on Animal Needs Index (Cattle and Pigs) • Minimum legal standard based on EU and national legislation • Estimated on farm condition extrapolated from own field study (Austria, 60 farms) • Overall: On farm condition above minimum standard ( … but several standards “binding”) Cross Compliance Assessment Tool