
Health and Risk Behaviors of New Jersey Middle School Students
This survey provides data on various health and risk behaviors among middle school students in New Jersey, including their perception of general health, seat belt usage, helmet-wearing habits, exposure to alcohol, weapon carrying, physical fights, and suicidal thoughts.

Health and Risk Behaviors of New Jersey Middle School Students
E N D
Presentation Transcript
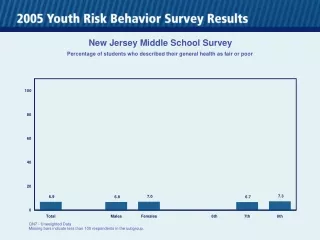
New Jersey Middle School Survey Percentage of students who described their general health as fair or poor 100 80 60 40 20 7.3 7.0 6.9 6.8 6.7 0 Total Males Females 6th 7th 8th QN7 - Unweighted Data Missing bars indicate less than 100 respondents in the subgroup.
New Jersey Middle School Survey Percentage of students who never or rarely wore a seat belt when riding in a car 100 80 60 40 16.0 20 14.2 12.8 12.0 10.1 0 Total Males Females 6th 7th 8th QN8 - Unweighted Data Missing bars indicate less than 100 respondents in the subgroup.
New Jersey Middle School Survey Among students who rode a bicycle, the percentage who never or rarely wore a bicycle helmet 100 77.7 75.9 80 71.8 68.0 67.9 60 40 20 0 Total Males Females 6th 7th 8th QN9 - Unweighted Data Missing bars indicate less than 100 respondents in the subgroup.
New Jersey Middle School Survey Among students who used rollerblades or rode a skateboard, the percentage who never or rarely wore a helmet 100 78.2 80 74.6 74.0 73.6 71.7 60 40 20 0 Total Males Females 6th 7th 8th QN10 - Unweighted Data Missing bars indicate less than 100 respondents in the subgroup.
New Jersey Middle School Survey Percentage of students who ever rode in a car driven by someone who had been drinking alcohol 100 80 60 40 30.2 30.0 27.3 25.4 24.0 20 0 Total Males Females 6th 7th 8th QN11 - Unweighted Data Missing bars indicate less than 100 respondents in the subgroup.
New Jersey Middle School Survey Percentage of students who ever carried a weapon, such as a gun, knife, or club 100 80 60 40 34.2 24.4 23.2 22.2 20 13.8 0 Total Males Females 6th 7th 8th QN12 - Unweighted Data Missing bars indicate less than 100 respondents in the subgroup.
New Jersey Middle School Survey Percentage of students who have ever been in a physical fight 100 80 73.2 61.3 59.6 58.3 60 47.8 40 20 0 Total Males Females 6th 7th 8th QN13 - Unweighted Data Missing bars indicate less than 100 respondents in the subgroup.
New Jersey Middle School Survey Percentage of students who were ever in a physical fight in which they were hurt and had to be treated by a doctor or nurse 100 80 60 40 20 7.2 6.9 6.1 5.6 5.1 0 Total Males Females 6th 7th 8th QN14 - Unweighted Data Missing bars indicate less than 100 respondents in the subgroup.
New Jersey Middle School Survey Percentage of students who ever seriously thought about killing themselves 100 80 60 40 28.4 23.0 22.8 22.7 16.1 20 0 Total Males Females 6th 7th 8th QN15 - Unweighted Data Missing bars indicate less than 100 respondents in the subgroup.
New Jersey Middle School Survey Percentage of students who ever made a plan about how they would kill themselves 100 80 60 40 20 15.2 13.1 11.9 11.1 8.0 0 Total Males Females 6th 7th 8th QN16 - Unweighted Data Missing bars indicate less than 100 respondents in the subgroup.
New Jersey Middle School Survey Percentage of students who ever tried to kill themselves 100 80 60 40 20 9.6 8.3 8.1 8.0 6.4 0 Total Males Females 6th 7th 8th QN17 - Unweighted Data Missing bars indicate less than 100 respondents in the subgroup.
New Jersey Middle School Survey Percentage of students who ever tried cigarette smoking, even one or two puffs 100 80 60 40 31.6 25.2 23.9 22.5 18.6 20 0 Total Males Females 6th 7th 8th QN18 - Unweighted Data Missing bars indicate less than 100 respondents in the subgroup.
New Jersey Middle School Survey Percentage of students who smoked a whole cigarette for the first time before age 11 years 100 80 60 40 20 4.3 4.3 4.2 4.2 4.1 0 Total Males Females 6th 7th 8th QN19 - Unweighted Data Missing bars indicate less than 100 respondents in the subgroup.
New Jersey Middle School Survey Percentage of students who smoked cigarettes on one or more of the past 30 days 100 80 60 40 20 6.3 6.3 5.1 4.2 3.8 0 Total Males Females 6th 7th 8th QN20 - Unweighted Data Missing bars indicate less than 100 respondents in the subgroup.
New Jersey Middle School Survey Percentage of students who smoked cigarettes on 20 or more of the past 30 days 100 80 60 40 20 1.4 1.0 0.9 0.8 0.4 0 Total Males Females 6th 7th 8th QNFRCIG - Unweighted Data Missing bars indicate less than 100 respondents in the subgroup.
New Jersey Middle School Survey Among students who are current smokers, the percentage who smoked more than 10 cigarettes per day on the days they smoked during the past 30 days 100 80 60 40 20 0 Total Males Females 6th 7th 8th QN21 - Unweighted Data Missing bars indicate less than 100 respondents in the subgroup.
New Jersey Middle School Survey Percentage of students who ever had a drink of alcohol, other than a few sips 100 80 60 49.7 41.2 39.0 37.2 40 31.5 20 0 Total Males Females 6th 7th 8th QN26 - Unweighted Data Missing bars indicate less than 100 respondents in the subgroup.
New Jersey Middle School Survey Percentage of students who had their first drink of alcohol other than a few sips before age 11 years 100 80 60 40 20 15.1 14.5 12.7 11.5 10.7 0 Total Males Females 6th 7th 8th QN27 - Unweighted Data Missing bars indicate less than 100 respondents in the subgroup.
New Jersey Middle School Survey Percentage of students who ever used marijuana 100 80 60 40 20 10.6 8.1 7.2 6.4 4.7 0 Total Males Females 6th 7th 8th QN28 - Unweighted Data Missing bars indicate less than 100 respondents in the subgroup.
New Jersey Middle School Survey Percentage of students who tried marijuana for the first time before age 11 years 100 80 60 40 20 1.4 1.1 0.9 0.8 0.4 0 Total Males Females 6th 7th 8th QN29 - Unweighted Data Missing bars indicate less than 100 respondents in the subgroup.
New Jersey Middle School Survey Percentage of students who ever used any form of cocaine, including powder, crack, or freebase 100 80 60 40 20 4.4 3.3 3.3 3.2 2.5 0 Total Males Females 6th 7th 8th QN30 - Unweighted Data Missing bars indicate less than 100 respondents in the subgroup.
New Jersey Middle School Survey Percentage of students who ever sniffed glue, breathed the contents of spray cans, or inhaled any paints or sprays to get high 100 80 60 40 20 10.4 10.1 9.4 8.3 8.2 0 Total Males Females 6th 7th 8th QN31 - Unweighted Data Missing bars indicate less than 100 respondents in the subgroup.
New Jersey Middle School Survey Percentage of students who ever used steroids 100 80 60 40 20 1.7 1.5 1.5 1.5 1.3 0 Total Males Females 6th 7th 8th QN32 - Unweighted Data Missing bars indicate less than 100 respondents in the subgroup.
New Jersey Middle School Survey Percentage of students who ever used a needle to inject any illegal drug into their body 100 80 60 40 20 0.8 0.7 0.6 0.5 0.5 0 Total Males Females 6th 7th 8th QN33 - Unweighted Data Missing bars indicate less than 100 respondents in the subgroup.
New Jersey Middle School Survey Percentage of students who were at risk for becoming overweight (i.e., at or above the 85th percentile but below the 95th percentile for body mass index, by age and sex)* 100 80 60 40 18.8 17.8 17.0 16.4 20 15.0 0 Total Males Females 6th 7th 8th *QNROVWGT - Unweighted Data - Based on reference data from the National Health and Nutrition Examination Survey I. Missing bars indicate less than 100 respondents in the subgroup.
New Jersey Middle School Survey Percentage of students who were overweight (i.e., at or above the 95th percentile for body mass index, by age and sex)* 100 80 60 40 20 15.5 13.5 12.8 12.0 10.4 0 Total Males Females 6th 7th 8th *QNOVWGT - Unweighted Data - Based on reference data from the National Health and Nutrition Examination Survey I. Missing bars indicate less than 100 respondents in the subgroup.
New Jersey Middle School Survey Percentage of students who described themselves as slightly or very overweight 100 80 60 40 31.1 29.3 29.0 28.9 26.6 20 0 Total Males Females 6th 7th 8th QN38 - Unweighted Data Missing bars indicate less than 100 respondents in the subgroup.
New Jersey Middle School Survey Percentage of students who were trying to lose weight 100 80 55.8 60 46.4 45.8 45.1 40 34.3 20 0 Total Males Females 6th 7th 8th QN39 - Unweighted Data Missing bars indicate less than 100 respondents in the subgroup.
New Jersey Middle School Survey Percentage of students who had ever exercised to lose weight or to keep from gaining weight 100 77.8 80 69.7 69.3 69.2 59.5 60 40 20 0 Total Males Females 6th 7th 8th QN40 - Unweighted Data Missing bars indicate less than 100 respondents in the subgroup.
New Jersey Middle School Survey Percentage of students who had ever eaten less food, fewer calories, or foods low in fat to lose weight or to keep from gaining weight 100 80 56.4 60 46.8 46.2 46.2 40 34.4 20 0 Total Males Females 6th 7th 8th QN41 - Unweighted Data Missing bars indicate less than 100 respondents in the subgroup.
New Jersey Middle School Survey Percentage of students who had ever gone without eating for 24 hours or more to lose weight or to keep from gaining weight 100 80 60 40 21.3 17.8 16.8 16.3 20 11.7 0 Total Males Females 6th 7th 8th QN42 - Unweighted Data Missing bars indicate less than 100 respondents in the subgroup.
New Jersey Middle School Survey Percentage of students who had ever taken diet pills, powders, or liquids without a doctor's advice to lose weight or to keep from gaining weight 100 80 60 40 20 6.0 4.5 4.5 4.6 2.8 0 Total Males Females 6th 7th 8th QN43 - Unweighted Data Missing bars indicate less than 100 respondents in the subgroup.
New Jersey Middle School Survey Percentage of students who had ever vomited or taken laxatives to lose weight or to keep from gaining weight 100 80 60 40 20 6.9 5.4 4.7 4.3 2.0 0 Total Males Females 6th 7th 8th QN44 - Unweighted Data Missing bars indicate less than 100 respondents in the subgroup.
New Jersey Middle School Survey Percentage of students who exercised or participated in physical activity that made them sweat and breathe hard for 20 minutes or more on three or more of the past seven days 100 77.5 80 74.2 73.0 71.2 69.3 60 40 20 0 Total Males Females 6th 7th 8th QN45 - Unweighted Data Missing bars indicate less than 100 respondents in the subgroup.
New Jersey Middle School Survey Percentage of students who watched three or more hours per day of TV on an average school day 100 80 60 50.3 48.4 47.6 46.5 45.9 40 20 0 Total Males Females 6th 7th 8th QN46 - Unweighted Data Missing bars indicate less than 100 respondents in the subgroup.
New Jersey Middle School Survey Percentage of students who attended physical education (PE) classes one or more days during an average school week 100 92.7 92.2 91.6 91.2 90.3 80 60 40 20 0 Total Males Females 6th 7th 8th QN47 - Unweighted Data Missing bars indicate less than 100 respondents in the subgroup.
New Jersey Middle School Survey Percentage of students who attended physical education (PE) classes daily in an average week when they were in school 100 80 60 35.9 40 34.9 34.6 34.5 33.5 20 0 Total Males Females 6th 7th 8th QNDLYPE - Unweighted Data Missing bars indicate less than 100 respondents in the subgroup.
New Jersey Middle School Survey Percentage of students who played on some sports teams 100 80 67.4 63.9 61.5 57.9 56.5 60 40 20 0 Total Males Females 6th 7th 8th QN48 - Unweighted Data Missing bars indicate less than 100 respondents in the subgroup.
New Jersey Middle School Survey Percentage of students who had been threatened or injured with a weapon such as a gun, knife, or club on school property one or more times during the past 12 months 100 80 60 40 20 14.0 13.9 11.3 9.3 9.1 0 Total Males Females 6th 7th 8th QN50 - Unweighted Data Missing bars indicate less than 100 respondents in the subgroup.
New Jersey Middle School Survey Percentage of students who did not go to school on one or more of the past 30 days because they felt they would be unsafe at school or on their way to or from school 100 80 60 40 20 8.1 8.0 7.7 7.4 7.4 0 Total Males Females 6th 7th 8th QN51 - Unweighted Data Missing bars indicate less than 100 respondents in the subgroup.
New Jersey Middle School Survey Percentage of students who had at least one drink of alcohol on one or more of the past 30 days 100 80 60 40 23.6 18.0 17.1 16.1 20 12.4 0 Total Males Females 6th 7th 8th QN52 - Unweighted Data Missing bars indicate less than 100 respondents in the subgroup.
New Jersey Middle School Survey Percentage of students who used marijuana one or more times during the past 30 days 100 80 60 40 20 5.6 4.3 4.1 3.8 3.0 0 Total Males Females 6th 7th 8th QN53 - Unweighted Data Missing bars indicate less than 100 respondents in the subgroup.
New Jersey Middle School Survey Percentage of students who participated in physical activity that did not make them sweat or breathe hard for 30 minutes or more on five or more days of the past seven days 100 80 60 40 26.2 24.7 23.7 22.9 21.9 20 0 Total Males Females 6th 7th 8th QN54 - Unweighted Data Missing bars indicate less than 100 respondents in the subgroup.
New Jersey Middle School Survey Percentage of students who were physically active for a total of 60 minutes or more per day on five or more of the past seven days 100 80 60 44.8 40 35.4 35.4 35.0 27.2 20 0 Total Males Females 6th 7th 8th QN55 - Unweighted Data Missing bars indicate less than 100 respondents in the subgroup.
New Jersey Middle School Survey Among students enrolled in physical education (PE) class, the percentage who actually exercised or played sports more than 20 minutes during an average PE class 100 83.8 83.2 81.6 79.8 79.2 80 60 40 20 0 Total Males Females 6th 7th 8th QN56 - Unweighted Data Missing bars indicate less than 100 respondents in the subgroup.
New Jersey Middle School Survey Percentage of students who drank three or more glasses of milk per day during the past seven days 100 80 60 40 18.2 20 14.4 14.4 14.3 11.1 0 Total Males Females 6th 7th 8th QN57 - Unweighted Data Missing bars indicate less than 100 respondents in the subgroup.
New Jersey Middle School Survey Percentage of students who have been taught about AIDS or HIV infection in school 100 92.5 89.8 88.7 87.8 85.9 80 60 40 20 0 Total Males Females 6th 7th 8th QN58 - Unweighted Data Missing bars indicate less than 100 respondents in the subgroup.
New Jersey Middle School Survey Percentage of students who responded that the last time they saw a dentist for a checkup, exam, teeth cleaning, or other dental work was during the past 12 months 100 80 70.6 70.1 69.9 69.6 69.2 60 40 20 0 Total Males Females 6th 7th 8th QN59 - Unweighted Data Missing bars indicate less than 100 respondents in the subgroup.
New Jersey Middle School Survey Percentage of students who had ever been told by a doctor or nurse that they had asthma 100 80 60 40 19.8 19.1 19.1 19.0 18.2 20 0 Total Males Females 6th 7th 8th QN60 - Unweighted Data Missing bars indicate less than 100 respondents in the subgroup.
New Jersey Middle School Survey Percentage of students who have ever been told by a doctor or nurse that they had asthma and who have asthma but had not had an episode of asthma or an asthma attack during the past 12 months or who had an episode of asthma or an asthma attack during the past 12 months (i.e., current asthma) 100 80 60 40 15.8 20 15.3 15.2 15.2 14.4 0 Total Males Females 6th 7th 8th QN61 - Unweighted Data Missing bars indicate less than 100 respondents in the subgroup.


