Download
1 / 130
1.3k likes | 1.43k Views
Explore how SciTools Incorporated navigates bidding uncertainty for a government contract, using decision analysis elements to guide optimal decision-making strategies.

E N D
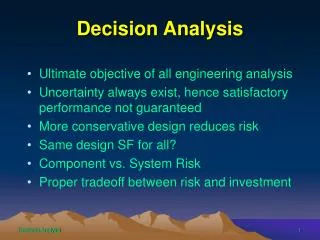
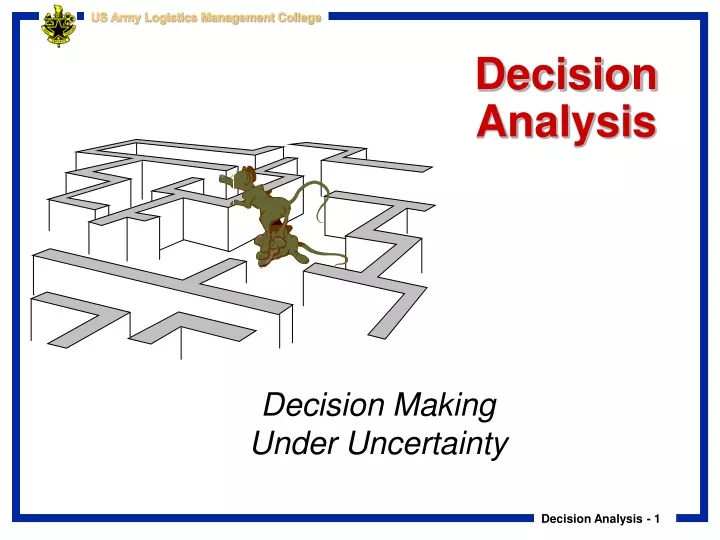
DecisionAnalysis Decision MakingUnder Uncertainty
Elements of a Decision Analysis Bidding for a Government Contract at SciTools
Background InformationBidding for a Government Contract at SciTools • SciTools Incorporated specializes in scientific instruments and has been invited to make a bid on a government contract to provide these instruments this coming year • SciTools estimates that it will cost $5000 to prepare a bid and $95,000 to supply the instruments • On the basis of past contracts, SciTools estimated the probabilities of the low bid from competitors at a certain dollar level • In addition, they believe there is a 30% chance that there will be no competing bids
Decision Making Elements • Although there is a wide variety of contexts in decision making, all decision making problems have three elements: • the set of decisions (or strategies) available to the decision maker • the set of possible outcomes and the probabilities of these outcome • a value model that prescribes results, usually monetary values, for the various combinations of decisions and outcomes • Once these elements are known, the decision maker can find an “optimal” decision
SciTools’ ProblemBidding for a Government Contract at SciTools • SciTools decision is whether to submit a bid and how much they should bid (the bid must be greater than $100,000 for SciTools to make a profit) • Based on the estimated probabilities, SciTools should bid either $115,000, $120,000, $125,000 (we’ll assume that they will never bid less than $115,000 or more than $125,000 due to the small profit margin or low chances of winning the bid) • The primary source of uncertainty is the behavior of the competitors - will they bid and, if so, how much? • The behavior of the competitors depends on how many competitors are likely to bid and how the competitors assess their costs of supplying the instruments
SciTools’ ProblemBidding for a Government Contract at SciTools • The value model in this example is straightforward but in other examples it is often complex • If SciTools decides right now not to bid, then its monetary values is $0 - no gain, no loss • If they make a bid and are underbid by a competitor, then they lose $5000, the cost of preparing the bid • If they bid B dollars and win the contract, then they make a profit of B - $100,000; that is, B dollars for winning the bid, less $5000 for preparing the bid, less $95,000 for supplying the instruments • It is often convenient to list the monetary values in a payoff table
SciTools’ Payoff TablesBidding for a Government Contract at SciTools
SciTools’ Payoff TablesBidding for a Government Contract at SciTools
Risk Profiles for SciToolsBidding for a Government Contract at SciTools • A risk profile simply lists all possible monetary values and their corresponding probabilities • From the alternate payoff table we can obtain risk profiles for SciTools • For example, if SciTools bids $120,000 there are two possibly monetary values, a profit of $20,000 or a loss of $5000, and their probabilities are 0.58 and 0.42, respectively • Risk profiles can be illustrated on a bar chart (the bars above each possible monetary value measure the probability of that value occurring)
SciTools’ Expected Monetary Values (EMV)Bidding for a Government Contract at SciTools • EMV is a weighted average of the possible monetary values, weighted by their probabilities • What exactly does the EMV mean? • It means that if SciTools were to enter many “gambles” like this, where on each gamble the gains, losses and probabilities were the same, then on average it would win $12,200 per gamble
Decision Tree ConventionsBidding for a Government Contract at SciTools • A decision tree is a graphical tool that can represent a decision problem with probabilities • Decision trees are composed of nodes (circles, squares and triangles) and branches (lines) • The nodes represent points in time • A decision node (a square) is a time when the decision maker makes a decision • A probability node (a circle) is a time when the result of an uncertain event becomes known • An end node (a triangle) indicates that the problem is completed - all decisions have been made, all uncertainty have been resolved and all payoffs have been incurred
Decision Tree ConventionsBidding for a Government Contract at SciTools • Time proceeds from left to right • Branches leading out of a decision node represent the possible decisions • Branches leading out of probability nodes represent the possible outcomes of uncertain events • Probabilities are listed on probability branches (these probabilities are conditional on the events that have already been observed ) • Individual monetary values are shown on the branches where they occur, and cumulative monetary values are shown to the right of the end nodes • Two values are often found to the right of each end node: the top one is the probability of getting to that end node, and the bottom one is the associated monetary value
Decision Tree Folding Back Procedure Bidding for a Government Contract at SciTools • The solution for the decision tree is on the next slide • The solution procedure used to develop this result is called folding back on the tree • Starting at the right on the tree and working back to the left, the procedure consists of two types of calculations • At each probability node we calculate EMV and write it below the name of the node • At each decision node we find the maximum of the EMVs and write it below the node name • After folding back is completed we have calculated EMVs for all nodes
The PrecisionTree Add-In • This add-in enables us to build and label a decision tree, but it performs the folding-back procedure automatically and then allows us to perform sensitivity analysis on key input parameters • There are three options to run PrecisionTree: • If Excel is not currently running , you can launch Excel and PrecisionTree by clicking on the Windows Start button and selecting the PrecisionTree item • If Excel is currently running, the procedure in the previous bullet will launch PrecisionTree on top of Excel • If Excel is already running and the Desktop Tools toolbar is showing, you can start PrecisionTree by clicking on its icon
Using PrecisionTreeBidding for a Government Contract at SciTools • Inputs: Enter the cost and probability inputs • New tree: Click on the new tree button (the far left button) on the PrecisionTree toolbar, and then click on any cell below the input section to start a new tree. Click on the name box of this new tree to open a dialog box. Type in a descriptive name for the tree. • Decision nodes and branches:To obtain decision nodes and branches, click on the (only) triangle end node to open the dialog box shown here
The PrecisionTree Add-InBidding for a Government Contract at SciTools • We’re calling this decision “Bid?” and specifying that there are two possible decisions. The tree expands as shown here. • The boxes that say “branch” show the default labels for these branches. Click on either of them to open another dialog box where you can provide a more descriptive name for the branch. Do this to label the two branches “No” and “Yes.” Also, you can enter the immediate payoff/cost for either branch right below it. Since there is a $5000 cost of bidding, enter the formula =BidCost right below the “Yes” branch in cell B19.
The PrecisionTree Add-InBidding for a Government Contract at SciTools • More decision branches: The top branch is completed; if SciTools does not bid, there is nothing left to do. So click on the bottom end node, following SciTools’ decision to bid, and proceed as in the previous step to add and label the decision node and three decision branches for the amount to bid. Note that there are no monetary values below these decision branches because no immediate payoffs or costs are associated with the bid amount decision.
The PrecisionTree Add-InBidding for a Government Contract at SciTools • Probability nodes and branches: We now need a probability node and branches from the rightmost end nodes to capture the competition bids • Click on the top one of these end nodes to bring up the dialog box • Click on the red circle box to indicate that this is a probability node. Label it “Any competing bid?”, specify two branches, and click on OK. • Label the two branches “No” and “Yes”. • Repeat this procedure to form another probability node following the “Yes” branch, call it “Win bid?”, and label its branches as shown on the next slide.
The PrecisionTree Add-InBidding for a Government Contract at SciTools • Copying probability nodes and branches: You could build the next node and branches or take advantage of PrecisionTree’s copy and paste function. Decision trees can be very “bushy”, but this copy and paste feature can make them much less tedious to construct.
Labeling probability branches: • First enter the probability of no competing bid in cell D18 with the formula =PrNoBid and enter its complement in cell D24 with the formula =1-D18 • Next, enter the probability that SciTools wins the bid in cell E22 with the formula =SUM(B10:B12) and enter its complement in cell E26 with the formula =1-E22
The PrecisionTree Add-InBidding for a Government Contract at SciTools • For the monetary values, enter the formula =115000-ProdCost in the two cells, D19 and E23, where SciTools wins the contract • Enter the other formulas on probability branches • Using the previous step and the final decision tree as a guide, enter formulas for the probabilities and monetary values on the other probability branches, that is, those following the decision to bid $120,000 or $125,000 • We’re finished! The completed tree shows the best strategy and its associated EMV. • Once the decision tree is completed, PrecisionTree has several tools we can use to gain more information about the decision analysis
Risk Profile of Optimal StrategyBidding for a Government Contract at SciTools • Click on the fourth button from the left on the PrecisionTree toolbar (Decision Analysis) and fill in the resulting dialog box (the Policy Suggestion option allows us to see only that part of the tree that corresponds to the best decision) • The Risk Profile option allows us to see a graphical risk of the optimal decision (there are only two possible monetary outcomes if SciTools bids $115,000)
Sensitivity AnalysisBidding for a Government Contract at SciTools • We can enter any values not the input cells and watch how the tree changes • To obtain more systematic information, click on the PrecisionTree sensitivity button • The dialog box requires an EMV cell to analyze at the top and one or more input cells in the middle • The cell to analyze is usually the EMV cell at the far left of the decision tree but it can be any EMV cell • For any input cell (such as the production cost cell) we enter a minimum value, a maximum value, a base value, and a step size • When we click Run Analysis, PrecisionTree varies each of the specified inputs and presents the results in several ways in a new Excel file with Sensitivity, Tornado, and Spider Graph sheets
Sensitivity Analysis: Sensitivity ChartBidding for a Government Contract at SciTools • The Sensitivity sheet includes several charts, a typical one of which appears here • This shows how the EMV varies with the production cost for both of the original decisions • This type of graph is useful for seeing whether the optimal decision changes over the range of input variable
Sensitivity Analysis: Tornado ChartBidding for a Government Contract at SciTools • The Tornado sheet shows how sensitive the EMV of the optimal decision is to each of the selected inputs over the ranges selected • The production cost has the largest effect on EMV, and bid cost has the smallest effect
Sensitivity Analysis: Spider ChartBidding for a Government Contract at SciTools • Finally, the Spider Chart shows how much the optimal EMV varies in magnitude for various percentage changes in the input variables • Again, the production cost has a relatively large effect, whereas the other two inputs have relatively small effects
Sensitivity Analysis: Two-Way AnalysisBidding for a Government Contract at SciTools • Use a two-way analysis to see how the selected EMV varies as each pair of inputs vary simultaneously • For each of the possible values of production cost and probability of no competitor bid, this chart indicates which bid amount is optimal • The optimal bid amount remains $115,000 unless the production cost and the probability of no competing bid are both large. Then it becomes optimal to bid $125,000
Multistage Decision Trees Marketing a New Product at Acme
Background Information • Acme Company is trying to decide whether to market a new product. • As in many new-product situations, there is much uncertainty about whether the product will “catch-on”. • Acme believes that it would be prudent to introduce the product to a test market first. • Thus the first decision is whether to conduct the test market.
Background Information -- continued • Acme has determined that the fixed cost of the test market is $3 million. • If they proceed with the test, they must then wait for the results to decide if they will market the product nationally at a fixed cost of $90 million. • If the decision is not to conduct the test market, then the product can be marketed nationally with no delay. • Acme’s unit margin, the difference between its selling price and its unit variable cost, is $18 in both markets.
Background Information -- continued • Acme classifies the results in either market as great, fair or awful. • Each of these has a forecasted total units sold as (in 1000s of units) 200, 100 and 30 in the test market and 6000, 3000 and 900 for the national market. • Based on previous test markets for similar products, it estimates that probabilities of the three test market outcomes are 0.3, 0.6 and 0.1.
Background Information -- continued • Then based on historical data on products that were tested then marketed nationally, it assesses the probabilities of the national market outcomes given each test market outcome. • If the test market is great, the probabilities for the national market are 0.8, 0.15, and 0.05. • If the test market is fair. then the probabilities are 0.3, 0.5, 0.2. • If the test market is awful, then the probabilities are 0.05, 0.25, and 0.7. • Note how the probabilities of the national market mirrors those of the test market.
Elements of Decision Problem • The three basic elements of this decision problem are: • the possible strategies • the possible outcomes and their probabilities • the value model • The possible strategies are clear: • Acme must first decide whether to conduct the test market. • Then it must decide whether to introduce the product nationally.
Contingency Plan • If Acme decides to conduct a test market they will base the decision to market nationally on the test market results. • In this case its final strategy will be a contingency plan, where it conducts the test market, then introduces the product nationally if it receives sufficiently positive test market results and abandons the product if it receives negative test market results. • The optimal strategies from many multistage decision problems involve similar contingency plans.
Conditional Probabilities - continued • The probabilities of the test market outcomes and conditional probabilities of national market outcomes given the test market outcomes are exactly the ones we need in the decision tree. • However, suppose Acme decides not to run a test market and then decides to market nationally. Then what are the probabilities of the national market outcomes? We cannot simply assess three new probabilities.
Conditional Probabilities - continued • These probabilities are implied by the given probabilities. This follows from the rule of conditional probability. • If we let T1, T2, and T3 be the test market outcomes and N be any national market outcomes, then by the addition rule of probability and the conditional probability formulaP(N) = P(N and T1) + P(N and T2) and P(N and T3) =P(N|T1)P(T1) + P(N|T2)P(T2) + P(N|T3)P(T3)
Conditional Probabilities - continued • This is sometimes called the law of probabilities. • We determine the probabilities as 0.425 for a great market, 0.37 for a fair market and 0.205 for an awful market. • The monetary values are the fixed costs of test marketing or marketing nationally and these are incurred as soon as the “go ahead” decisions are made.
ACME.XLS • This file contains the inputs for the decision tree. • The only calculated values in this spreadsheet are in row 28, which follow from the equation. The formula in cell B28 is=SUMPRODUCT(B22:B24,$B$16:$B$18)then it is copied across row 28. • The creation of the tree is then straightforward to build and label.
Interpreting the Tree • The interpretation of the tree is fairly straightforward if we realize that each value just below each node name is an EMV. • Each of these EMVs have been calculated with the folding back procedure. • We can also see Acme’s optimal strategy by following the “TRUE” branches from left to right.
Optimal Strategy • Acme should first run a test market and if the results are great then they should market it nationally. • If the test results are fair or awful they should abandon the product. • The risk profile for the optimal strategy can be seen on the next slide. • The risk profile (created by clicking on PreceisionTree’s “staircase” button and selecting Statistics and Risk Profile options) that there is a small chance of two possible large losses, there is a 70% chance of a moderate loss and there is a 24% chance of a nice profit.
Optimal Strategy -- continued • One might argue that the large potential (70%) chance of some loss should persuade Acme to abandon the product right away - without a test market. • This is what “playing the averages” with EMV is all about. • Since the EMV of this optimal strategy is greater than 0, Acme should go ahead with this strategy if it is an EMV maximizer.
Expected Value of Sample Information • The role of the test market in this example is to provide Acme with information. • Information usually costs, in this case its fixed cost is $3 million. • From the decision tree we can see that the EMV from test marketing is $807,000 better than the decision not to test market. The most Acme would be willing to pay for the test marketing is $3.807 million. • This value is called the expected value of sample information or EVSI.
Expected Value of Sample Information -- continued • In general we can write the following expression:EVSI=EMV with free information - EMV without information • For the Acme example the EVSI is $3.807 million. • The reason for the term sample is that the information does not remove all uncertainty about the future. • That is, even after the test market results are in, there is still uncertainty about the national market.
Expected Value of Perfect Information • We can go one step further and ask how much perfect information is worth. • Perfect could be imagined as an envelope containing the final outcome. • No such envelope exists but if it did how much would Acme be willing to pay for it? • This question can be answered with the decision tree shown on the next slide. • Folding back produces an EMV of $7.65 million.