Download
1 / 26
260 likes | 283 Views
This study focuses on the retrieval and interpretation of UV/Vis satellite observations of tropospheric composition, specifically on tropospheric NO2. It discusses the challenges in tropospheric chemistry, the need for more accurate emission inventories, and the processes controlling tropospheric ozone. The study also explores the use of top-down information from the GOME and SCIAMACHY satellite instruments.

E N D
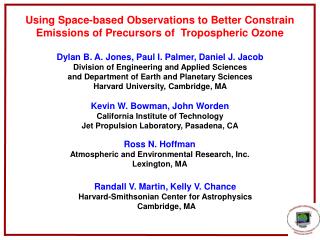
Retrieval and Interpretation of UV/Vis Satellite Observations of Tropospheric Composition Randall Martin With contributions from: Rongming Hu (Dalhousie University) Chris Sioris, Xiong Liu, Kelly Chance (Smithsonian Astrophysical Observatory) Lyatt Jaeglé, Linda Steinberger (Univerisity of Washington) Yongtao Hu, Armistead Russell (Georgia Tech) Tom Ryerson, Andy Neuman (NOAA/CIRES) Ron Cohen (Berkeley) Aaron Swanson, Frank Flocke (NCAR) Andreas Richter (University of Bremen)
Major Challenges in Tropospheric Chemistry More Accurate Emission InventoriesUnderstand Processes Controlling Tropospheric OzoneConstrain Aerosol Properties
Top-Down Information from the GOME and SCIAMACHY Satellite Instruments GOME 1995-2002 Spatial resolution 320x40 km2 Global coverage in 3 days SCIAMACHY 2002-present Spatial resolution 60x30 km2 Global coverage in 6 days Pixel Uncertainty 5-10x1014 molec cm-2 Spectral Fit Martin et al., 2002, 2005 Total NO2 Slant Column 2-10x1014 molec cm-2 Remove Stratosphere Martin et al., 2002 Tropospheric NO2 Slant Column Palmer et al. 2001 Martin et al., 2002, 2003, 2005 Calculate AMF 40% Tropospheric NO2 Column Mean Total ±(5x10¹⁴ + 30%)
ICARTT Campaign Over and Downwind of Eastern North America in Summer 2004 Aircraft Flight Tracks and Validation LocationsOverlaid on SCIAMACHY Tropospheric NO2 Columns NASA DC-8 NOAA WP-3D May-Oct 2004
Air Mass Factor Calculation in SCIAMACHY Retrieval Needs External Info on Shape of Vertical Profile Increased NOx Emissions from Midlatitude Improves GEOS-CHEM Simulation of NO2 Profiles Remaining Discrepancy In Vertical Profile of NOx Emissions In Situ 0.4 Tg N yr-1 1.6 Tg N yr-1 Midlatitude lightning Mean Bias in AMF: 0.4 Tg N yr-1 12% 9% 3% 1.6 Tg N yr-1 1% 5% 3% NO2 Measurements from Cohen (DC-8) and Ryerson (WP-3D)
Enhanced Midlatitude Lightning Reduces Discrepancy with SCIAMACHY over North AtlanticProfile of NOx Emissions (lifetime) May Explain Remaining Discrepancy SCIAMACHY NO2 (1015 molec cm-2) GEOS-Chem NO2 (1015 molec cm-2) 1.6 Tg N in Midlat GEOS-Chem NO2 (1015 molec cm-2) 0.4 Tg N in Midlat May-Oct 2004
Significant Agreement Between Coincident Cloud-Filtered SCIAMACHY and In-Situ Measurements r = 0.79 slope = 0.8 1:1 line Cloud-radiance fraction < 0.5 In-situ measurements below 1 km & above 3 km Assume constant mixing ratio below lowest measurement Add upper tropospheric profile from mean obs Cohen (DC-8) Ryerson (WP-3D) Horizontal bars show 17th & 83rd percentiles Chris Sioris
Cloud-filtered Tropospheric NO2 Columns Retrieved from SCIAMACHY May-Oct 2004 detection limit
1996 - 2002 Annual changes in tropospheric NO2 observed with GOME A. Richter et al. Nature, 437, 129-132, 2005
Conduct a Chemical Inversion & Combine Top-Down and Bottom-up Inventories with Error Weighting A Priori NOx Emissions SCIAMACHY NO2 Columns GEIA 1011 molec N cm-2 s-1 1015 molec cm-2 GEOS-CHEM model Error weighting A posteriori emissions Top-Down Emissions
Global Optimal Emission Inventory RevealsMajor Discrepancy in NOx Emissions from Megacities May-Oct 2004 r2=0.82 vs a priori
A Posteriori NOx Emissions from East Asia Exceed Those from Either North America or Europe
Large Change in NOx Emissions Near New York City r2= 0.92 A posteriori – A priori A priori A posteriori 7.2 Tg N 7.8 Tg N 0.6 Tg N 1011 atoms N cm-2 s-1 1011 atoms N cm-2 s-1 1011 atoms N cm-2 s-1 Evaluate Each Inventory By Conducting GEOS-CHEM Simulation & Sampling Model Along Aircraft Flight Tracks Simulation with A Posteriori – Simulation with A Priori NOx (pptv) PAN (pptv) HNO3 (pptv)
In Situ Airborne Measurements Support A Posteriori Inventory New England New England New England + Gulf GEOS-CHEM (A priori) GEOS-CHEM (A posteriori) In Situ P-3 Measurements from Tom Ryerson (NOAA) Aaron Swanson Andy Neuman Frank Flocke (NCAR) (CIRES/NOAA)
EMIS: Emissions Mapping Integration ScienceOptimize NOx Emissions SCIAMACHY NO2 Columns NOx Emissions (SMOKE/G.Tech) Aug 2004 May-Oct 2004 1011 molec N cm-2 s-1 1015 molecules cm-2 CMAQ Error weighting A posteriori emissions Top-Down Emissions
Fuel Combustion 1. Spatial location of FF-dominated regions in a priori (>90%) 1 2 Biomass Burning 2. Spatiotemporal distribution of fires used to separate BB/soil VIRS/ATSR fire counts Soils No fires + background Algorithm for partitioning top-down NOx inventory (2000) GOME NOx emissions Algorithm tested using synthetic retrieval Jaeglé et al., 2005
Biomass Burning (2000) A priori A posteriori 1010atoms N cm-2 s-1 r2= 0.72 (±200%) (±80%) SE Asia/India: 46% decrease N. Eq. Africa: 50% increase Line: A priori (BB) SE Asia/IndiaN. Eq. Africa S. Eq. Africa A posteriori total Bars: A posteriori (BB) • Good agreement with BB seasonality from Duncan et al. [2003] Jaeglé et al., 2005
Largest soil emissions: seasonally dry tropical + fertilized cropland ecosystems Speciated Inventory for Soil emissions A posteriori 70% larger than a priori! A priori A posteriori r2= 0.62 (±90%) (±200%) North Eq. Africa East Asia Soils Soils Onset of rainy season: Pulsing of soil NOx! Jaeglé et al., 2005
Direct Retrieval of Tropospheric Ozone from GOMEUsing Optimal Estimation in Ultraviolet with TOMS V8 a priori GOME GEOS-CHEM Tropospheric Ozone Column (Dobson Units) Liu, Chance, et al., 2005
Northern Tropics Remain a Challenge for Satellites and Models Comparison with MOZAIC Ozone Measurements Liu, Chance, et al., 2005
Backscattered Radiation is Sensitive to Single Scattering Albedo Over Bright Surfaces TOMS Aerosol Index Measures Absorbing Aerosols In Ultraviolet Where Rayleigh Scattering Acts as Bright Surface July 2000
Aerosol Absorption Contributes to Differences Between Aerosol Optical Depth and the Absorbing Aerosol IndexAerosol Vertical Profile Also Important 1.5 1.1 0.8 0.4 0 MODIS July 2000 3.0 2.2 1.6 0.8 0 TOMS July 2000
Retrieval of Aerosol Single Scattering AlbedoDetermined with radiative transfer calculation as SSA that reproduces TOMS Aerosol Index when constrained by MODIS aerosol optical depth and GEOS-CHEM aerosol vertical profile MODIS AOT GEOS-CHEM profiles LIDORT RTM Min calc – obs aerosol index July 2000 SSA Rongming Hu
Significant Agreement With Aerosol Single Scattering Albedo Determined from AERONET r = 0.8 Slope = 1.01 Intercept = -0.02 Rongming Hu
Conclusions Growing confidence in top-down constraint on NOx emissions Underestimate in NOx emissions from megacities, in soils, and North American lightning Puzzling ozone distribution in northern tropics Promise for global retrieval of aerosol single scattering albedo
Acknowledgements Rongming Hu (Dalhousie University) Chris Sioris, Xiong Liu, Kelly Chance (Smithsonian Astrophysical Observatory) Lyatt Jaeglé, Linda Steinberger (Univerisity of Washington) Yongtao Hu, Armistead Russell (Georgia Tech) Tom Ryerson, Andy Neuman (NOAA/CIRES) Ron Cohen (Berkeley) Aaron Swanson, Frank Flocke (NCAR) Andreas Richter (University of Bremen) Funding: • National Aeronautics and Space Administration (NASA) • Canadian Foundation for Innovation (CFI) • Canadian Foundation for Climate and Atmospheric Sciences (CFCAS) • Natural Sciences and Engineering Research Council of Canada (NSERC) • Nova Scotia Research and Innovation Trust (NSRIT)