Download
1 / 26
260 likes | 396 Views
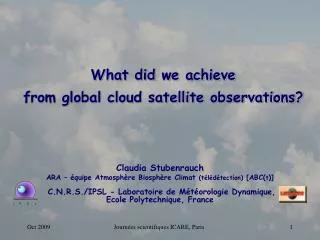
What did we achieve from global cloud satellite observations?. Claudia Stubenrauch ARA – équipe Atmosphère Biosphère Climat (télédétection) [ABC( t )] C.N.R.S./IPSL - Laboratoire de Météorologie Dynamique, Ecole Polytechnique, France. Intercomparisons and what we learn from them

E N D
What did we achieve from global cloud satellite observations? Claudia Stubenrauch ARA – équipe Atmosphère Biosphère Climat (télédétection) [ABC(t)] C.N.R.S./IPSL - Laboratoire de Météorologie Dynamique, Ecole Polytechnique, France Journées scientifiques ICARE, Paris
Intercomparisons and what we learn from them • Synergy of datasets and of datasets & modelling Cloud Assessment Cloud properties from space: Passive remote sensing (>1980) Active (A-Train, ≥2006) info on highest cloud layer info on all cloud layers good spatial coverage sparse sampling (track/1000km) • CA (tot, high, midlevel, low) • p/z, T, tVIS / eIR • horizontal extension • bulk microphysical properties • z, tVIS • vertical extension • cloud layering • microphys. prop. profiles Journées scientifiques ICARE, Paris
Longterm cloud climatologies: *ISCCPGEWEX cloud dataset 1984-2007 (Rossow et al. 1999) PATMOS-xAVHRR 1981-2007 (NESDIS/ORA; Heidinger) *TOVS Path-B7h30/19h30 1987-1995 (Stubenrauch et al. 2006) HIRS-NOAA13h30/1h301985-2001 (Wylie et al. 2005) SAGE limb solar occultation1984-2005 (Wang et al. 1996, 2001) SOBSSurface OBServations1952-1996 (Hahn & Warren 1999; 2003) Cloud Assessment EOS cloud climatologies (since 2001, 2002): MODIS-ST (Ackerman et al.; Platnick et al.)*MODIS-CE (Minnis et al.) *AIRS-LMD(Stubenrauch et al. 2008, 2009) MISR (DiGirolamo) + A-Train(since 2006): CALIPSO (Winker et al. 2007, 2009) CloudSat(Mace et al. 2009) GOCCP (Chepfer et al. 2009) POLDER(Riedi) netCDF data * most complete variables co-chairs: C. Stubenrauch, S. Kinne http://climserv.ipsl.polytechnique.fr/gewexca *ATSR-GRAPEERS, 1997-2000 (Poulsen) Journées scientifiques ICARE, Paris
CAHR CAMR CALR CA oc lnd oc lnd oc lnd oc lnd CALIPSO ● Preliminary results from common data base in netCDF format Global spread: 0.15/0.20 CALIPSO highest CA & CAHR (sensitive to subvisible Ci) 70 % CA (+ 10%): 5-15% more over ocean than over land 40% high clouds: more over land than over ocean 40% single-layer low clouds: more over ocean than over land IR sounders ~ 10% more sensitive to Ci than ISCCP(15% in trps) MISR, ATSR-GRAPE, ISCCP (esp. night) :problems with thin Ci & Ci above low cloud Journées scientifiques ICARE, Paris
ISCCP MODIS-ST S. Cros HCA (%) PATMOS-x MODIS-CE ISCCP TOVS Path-B CALIPSO CALIPSO (t > 0.1) AIRS_LMD CALIPSO AIRS-LMD IASI prelim. (%) CAH geographical distributions (July) absolute values depend on instrument sensitivity & method, but distributions similar Journées scientifiques ICARE, Paris
SH CAHR CALR 0°-30° SAGE 30°-60° 60°-90° seasonal cycle of CAHR / CALR Seasonal cycles similar CAHR = CAH/CA: 30% in SH tropics to 5% in SH midlatitudes CALR = CAL/CA: modulated by HCA & MCA seas. cycle • only for single layer low clouds SH subtropics Stracum regions: SOBS 18% more LCA & smaller seas. cycle Journées scientifiques ICARE, Paris
NH Tcld high (K) TOVS-B ISCCP PATMOS-x AIRS CALIPSO: all t>0.1 0°-30° 60°-90° 30°-60° Tcld low (K) cloud temperature of high / low clouds Seasonal cycle of high Tcld decreases from polar (15°), midlat (10°) to tropics (5°) low Tcld (20°) (20°) (5°) CALIPSO: thin high clouds colder than thicker high clouds (t>0.1), esp. in tropics uncertainties in cloud height determination (esp. thin cirrus), T profiles Journées scientifiques ICARE, Paris
ISCCP CALIPSO TOVSAIRS ocean Tcld high (K) SH 0°-30° TOVS-B ISCCP PATMOSX MODIS-CE AIRS CALIPSO: all t>0.1 t>0.2 O Clouds in tropics have diffuse cloud tops: CALIPSO max backscatter ≥ 1km below cloud top midlatitudes AIRS-LMD: ___ ecld > 0.95 --- 0.95 > ecld > 0.50 …. 0.50 > ecld > 0.05 Tropical high clouds: Tcld distributions Journées scientifiques ICARE, Paris
ISCCP TOVS-B MODIS-CE MODIS-ST • AIRS-LMD results, preliminary A. Guignard • 16 channels between 8 and 12 micron • Ice crystal shape estimation: more columns than aggregates SSP’s by A. Baran (MetOffice), LUT’s using 4A-DISORT radiative transfer NIR-VIS: De near cloud top IR: De averaged over cloud depth aggregates assumed JJA DJF preliminary effective ice crystal diameter Journées scientifiques ICARE, Paris
A-Train:synergy of passive & active instruments AIRSon Aqua (≥2002): CALIPSO, CloudSat (≥ 2006): only nadir viewing • Synergy with CALIPSO provides : • - choice of variables & thresholds for cloud detection • - cloud height evaluation, cloud layering • essential for: • cloud property climatology from AIRS • retrieval implementation on other IR sounders (IASI series, TOVS reanalysis) -> 1985 - 2020 MODIS-POLDER-AIRS-CERES-CALIPSO-CloudSat synergy: -> clouds-aerosols-radiation; 3D view; however, no transport studies possible Journées scientifiques ICARE, Paris
HIRS-NOAA TOVS-B ISCCP PATMOS-x 3 sat 4 sat. 5 sat. Longterm datasets • trend analysis : 1) be very careful of artificial satellite features(cluster analysis J. Norris) global CLA within ±2.5% 2) use synergy of different variables • explore rare events : tropical convection penetrating into the lower stratosphere cluster analysis of ISCCP DX data (Rossow & Pearl GRL 2007) occurrence predominantly in larger, organized mesoscale convective systems Journées scientifiques ICARE, Paris
RHice < 70% & RHwat > 0.4 RH*crit Risk of contrail occurrence Stubenrauch & Schumann, GRL 2005 stronger increase related to contrails in NH increase of thin Ci in both hemispheres synergy ice saturation - cirrus Lamquin, TAC 2009, thèse Nov 2009 Journées scientifiques ICARE, Paris
30/12/1989 7:30 PM TOVS Path-B Belhaj 2007 De(mm) TOVS Path-B Belhaj 2007 200 600 Distance to convective cell(km) Instantaneous global coverage • explore horizontal extension of cloud systems & relation with thermodynamic and dynamic properties: cluster analyses (ISCCP: Rossow & Jakobs, GRL 2005; TOVS Path-B: Rädel 2004) Tropical systems ~50% of Ci originate from convection (Luo & Rossow, J. Climate 2004) anvil size increases continuously with decreasingTmin ISCCP Machado & Rossow 1993 but also depends on dynamics; Chen et al. JGR 1997Belhaj et al. 2007 Evolution of De during life cycle of convective system • De increases with distance from convective cell • De increases during life cycle of system Journées scientifiques ICARE, Paris
eliminate multi-layer clouds TOVS atmospheric profiles cirrus properties De=10-90mm; De=f(IWP),= f(T) ADMs • radiative transfer model: • pcld = p(mid-cloud) Dp = 100 hPa( 2 km) • Single scattering properties (SSPs) = f(l, De) for hex. columns, aggregates • choose IWP with e(IWP,De) ecldIR look-up tables ecldIR(IWP,De),depending on qv, Dz, SSPs 1500 ScaRaB fluxes simulated fluxes Synergy of retrieved cloud properties & model : Cirrus radiative flux analysis Journées scientifiques ICARE, Paris
aggregates fitting obs. aSW hex. columns Stubenrauch et al. J. Clim. 2007 Coherence between IR IWP and SW albedo best fit to data: increase of De with IWP columns only fit data at small IWP, aggregates at larger IWP Journées scientifiques ICARE, Paris
70% (+10%) clouds: ~ 40% high clouds & ~40% single-layer low clouds • geographical cloud structures and seasonal cycles agree quite well • absolute values depend on instrument sensitivity (& retrieval method) • Longterm datasets: good statistics on seasonal cycles; explore rare events; trend analysis difficult (synergy of variables) • GEWEX Cloud Assessment: WCRP report in preparation (2010) • monthly mean cloud parameters (CA,HCA,MCA,LCA,Tcld,e,t, Deff,WP), variabilities, uncertainties will be available in netcdf at: http://climserv.ipsl.polytechnique.fr/gewexca • Synergy of different data sets & variables very important: Evaluation of climate models by comparing correlations! • important to synchronize satellite missions (A-Train) EarthCARE (1:30AM/PM) – IASI Metop (10AM/PM) synergy ? Journées scientifiques ICARE, Paris
near noon early evening Cairns, Atm. Res. 1995 diurnal cycle of clouds ISCCP C2, Complex Empirical Orthogonal Functions, project. on distorted diurnal harmonics • Low clouds over land: significant diurnal cycle, max early afternoon • Low clouds over ocean: max in early morning • High clouds: max in evening • Mid clouds: max in early morning or late at night (-> cirrus : TOVS analysis) Stubenrauch et al. 2006 Journées scientifiques ICARE, Paris
Stubenrauch et al. J. Climate 2006 TOVS-B diurnal cycle of high clouds NOAA10/12 7h30 AM&PM, NOAA11 2h00 AM&PM(1989-90) NOAA11 4h30 AM&PM(1994-95) strongest diurnal cycles over land, in tropics (& in midlat summer) • max Cb (ISCCP) in early evening • max. thick (large-scale) cirrus & cirrus in evening • cirrus occurrence continues during night & decreases during day • max. thin cirrus in early afternoon Journées scientifiques ICARE, Paris
good agreement between ISCCP, PATMOSX, MODIS-CE MODIS-ST: 2.1 mm instead of 3.7 mm Cirrus contamination ? ISCCP PATMOSX MODIS-CE MODIS-ST reff (mm) preliminary water cloud effective droplet radius ISCCP: AVHRR NIR-VIS Han, Rossow & Lacis J. Clim. 1994, Han et al. 1998 re slightly larger over ocean than over land Journées scientifiques ICARE, Paris
Uncertainties on ice crystal size retrieval Rädel et al., JGR 2003 Overestimation of De: thin Ci with underlying water cloud partial cover of thick Ci hexagonal colmuns instead of polycrystals up to 25% Underestimation of De: increasing De with cloud depth broader size distribution up to 25% Journées scientifiques ICARE, Paris
Trends of cld type amount ISCCP: 1991 Mt Pinatubo eruption 4% effect on HCA and LCA Journées scientifiques ICARE, Paris
CA change : cluster analysis correcting for artefactsJ. Norris http://meteora.ucsd.edu/~jnorris/isccp_artifacts.html 6 clusters out of 7 related to artificial satellite features: sea-ice: Oct-Dec 2004, high lat land: > Oct 2001(NOAA16) nb of GEOs - view angle, GEO view area Journées scientifiques ICARE, Paris
RHice distributions AIRS L2 Tropics, 100-300 hPa clear Cirrus SVC Lamquin et al. JGR 2008 RHice increases with Dzcld but: <RHice> ≈ 65% even if whole layer is filled AIRS RHice 60 % CALIPSO rel. geometrical cloud layer thickness How can we detect ice supersaturation from satellite observations ? TOVS/AIRS humidity: per layer Stubenrauch & Schumann GRL 2005 Kahn et al. Atmos. Chem. Phys. 2007 ice supersaturation : RHice > 60% (peak for Ci) Journées scientifiques ICARE, Paris
De & IWP as function of humidity & wind Large-scale semi-transparent cirrus 60°N – 60°S, 4 year averages Stubenrauch et al., Atm. Res.2004 IWP and De increase with atmospheric water vapour IWP largest in case of strong large-scale vertical updraft De smallest in case of strong large-scale hor. & vert. winds TOVS -ERA40 Journées scientifiques ICARE, Paris
AIRS cloud property retrieval Minimization χ2 based on TOVS Path-B retrieval (Stubenrauch et al. J. Climate1999): TIGR atm transmission database L2 atm. profiles (T,H2O) AIRS L1b radiances (Im) CO2 absorption band channels proximity recognition Clear and Cloudy AIRS radiances computation (Iclr, Icld) Surface emissivity CALIPSO L2 cloud products A posteriori cloud detection pcld,εcld, Tcld, zcld, ελ(12 – 8 µm) Journées scientifiques ICARE, Paris Microphysics properties
Cloud height evaluation with CALIPSO Journées scientifiques ICARE, Paris