Oceanography Virtual Field Guide
Join us on a virtual field trip to Wacheapreague, Virginia, where we collected data on estuary sites in October 2005. Discover the diverse biological, geological, and meteorological data we gathered, including plankton, benthic organisms, and neckton. Compare the different types of life found at each site and learn about the unique ecological characteristics we observed. Dive into the details of our exploration and findings in this comprehensive oceanography guide.

Oceanography Virtual Field Guide
E N D
Presentation Transcript
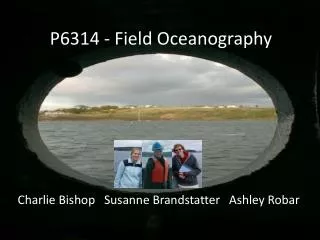
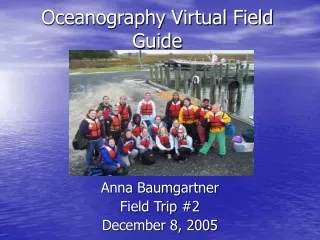
Oceanography Virtual Field Guide Anna Baumgartner Field Trip #2 December 8, 2005
Abstract Our Oceanography class went on a field trip to Wacheapreague, Virginia. I went on the second trip which was October 20-22, 2005. On October 21, we went out on a boat to three different estuary sites and collected different data. At each site, we collected meteorological data, physical and chemical water data, temperature, salinity, dissolved oxygen, and pH. We also took sediment samples and collected biological data. We collected this data using many different tools and instruments. Based on our findings, we made observations and explained relationships between different sets of data. Overall, we came to the results that we were in a well and partially mixed estuary with a wide range of sediment and biological life.
Where did we go?? • The Details of the Field Trip • Wacheapreague, Virginia • Collected Data from 3 different sites • All 3 sites were estuaries on the coast
3 • This is the map of the coastline of Wacheapreague, Virginia • The 3 sites are noted on the map of where we collected our data • Site 1 was furthest out to the wide open ocean, Site 3 was the closest to the shore 2 1
Meteorological Data on October 21, 2005 • Moon Phase: Waning Gibbous • High Tide: 11:20 am • Low Tide: 5:55 pm
Biological Life • We categorized our data into three different types of biological life • Plankton • Drifters • Neckton • Swimmers • Benthic • Bottom Dwellers
How We Collected Biological Life • We took samples of biological life in three different ways • Dredge • Drug along the bottom of the ocean floor • Usually collects benthic organisms • Trawl • A long net that is drug through water • Usually collects neckton organisms • Plankton Net • A cone shaped net that only collects very tiny or microscopic organisms • Collects Plankton, drifters, and other microscopic organisms
Above: Trawl- Pulling it out of the water to see what we collected • Middle: Dredge- Pulling it in and seeing what we collected • Below: Plankton Net- Pulling it out of the water and collecting it in the bottom of the net
Types of Plankton We Found • Site 2 • Fish larvae • Shrimp-like forms • copepods • Parasitic copepods • Jellyfish (very small) • Site 3 • Pilidium larvae • Diatom Coscineouscus • Cyclopoida • Site 1 • Ostracods • Copepods • Isopods • Siphonophores • Mupid shrimp family
Comparisons and Differences • All three sites had similar types of plankton. • Breaking plankton into two groups • Zooplankton • Phytoplankton • Site 1,2, and 3 had a lot of zooplankton • Site 3 was the only site that we found some phytoplankton which was a diatom, but still did not see a lot of phytoplankton • Site 3 was much calmer than Site 1 and 2 and could be reason why the phytoplankton was found in Site 3
Site 1 Hermit Crab in Shell Site 2 Jellyfish Northern Shortfin Squid Perch fish Spotfish Horseshoe Crab (left) Baby crabs Types of Neckton Organisms We Found • Site 3 • Blue Fish • Anchovies • Oyster Toads • Squid (down below)
Observations and Explanations • Very similar neckton organisms were found at all three sites. • We didn’t find as much at Site 1, but I don’t think this was due to the Site. We had a problem with the trawl at first and didn’t properly get all the biological data that I think there is at this site. • The neckton is probably all similar between all the sites because they are free swimming organisms that can move freely from site to site wherever they wish.
Types of Benthic Organisms We Found at Site One • Atlantic Purple Sea Urchins • Old Oyster Shells • Brizoa • Reddish Seaweed • Choral • Barnicals • Tube Worms • Jingle Shells • Parchment Worm • Boran Sponge • Slipper Shell • Crapagila Fornicada • Oyster Shells with • baby clam • Chiton • Tailed priapulid worm
Types of Benthic Organisms We Found at Site 2 • Lemon Drop Seaslug • Chiton • Slipperlimpet • Parchment Worm • Snail • Deadman’s Finger (algae-codium) • Red seaweed • Sealettuce – ulva lactuca • Tons of coral • Orange sponge (redbeard) • Boring sponge • Encrusted Oyster Shells (bryozoan) • Razor clam shell • Orange soft body • hybroid
Types of Benthic Organisms Found at Site 3 • Oyster Shells • Snail Shells • Gastropods • Barnacles • Head-foot cephelopoda • Shrimp • Sponges • Parchment Worms
Observations and Explanation • Site 1 and Site 2 have oysters, clams, and many harder organisms that cling onto and live on old oyster shells. • They are generally a harder material • Site 3 has some of these oysters, etc. but also has many sponges and more soft body organisms. • Explanation: • Site 1 is near the inlet and the harder shells can withstand the currents while the softer body organisms are in a calmer estuary.
Geological Data • In order to get a sediment sample from every site, we used a tool called a baby-box corer • To the right is a picture of somebody dropping it into the water to get the sample
Comparisons of Sediment • All three sediments were pretty different • Site 1 was hard as a rock while site 3 was very soft • Site 1 was probably hard because it is near the inlet to the open ocean. Sediment is transferred from the continent to the open ocean and are moved by the current. It does not have time to stay put. • Site 3 was the softest because it was the most inland pretty closed in. It is easier for sediment to be transferred down and stay there making a soft ocean floor.
Benthic vs. Sediment • We found harder, more stable benthic organisms in Site 1 than we did in Site 3 such as old oysters and jingle shells. • We found benthic organisms such as sponges in Site 3. • This is because old oysters can withstand the current in Site 1 and probably prefer having food swift by them to eat while organisms such as sponges would much rather be in a soft, calm environment. • Sediments being moved by river currents are not a good home for many bottom dwellers that want to stick to one area such as a sponge.
Water Data What we kept our water samples in • We collected a lot of data concerning the depth, salinity, visibility, etc of the ocean water at each site • We used three main tools in order to take this data. They were • Niskin • A water collumn that snapped at a certain depth • Secchi Disk • Black and white disk that was used to test visibility of water • YSI (electronic probe) • a sensitive probe that could test salinity and temperature of the water at a certain depth Secchi Disk Niskin
Physical Water Data • Total Photic Zone depth was measured by the secchi disk
Observations and Explanation • The water visibility was hardly much at all. • It was similar for all three sites • This is probably because of the wind and how rough the water was the day we went out. • To the right is a picture of Site 1. You can see how rough and windy it was. • Another reason there wasn’t much visibillity is that there were a lot of sediments moving with the current floating in the water that makes visibility harder.
Observations and Explanation: • Temperature did not change at all for any site as far as depth. • Site 1 was the warmest, Site 3 was the coldest, by a difference of about 1° • The water temperature was slightly warmer than the outside temperature of 17.4 °C • Temperature is probably usually stable for this depth of water. There wont be much change until the seasons change. • It is hard for temperature to change much. The outside temperature must change dramatically.
Observations and Explanations • Site 1 and Site 3 did not change salinity with depth. However, Site 2 changed a lot between 0 and 1 m deep. • The salinity decreased as we moved inland to Site 3 slightly. This is because more freshwater is mixed in at this site. • Site 1 and 3 were well mixed estuaries (above right). • Site 2 had a lower salinity of 26.4 ppt at the surface. I would think that Site 2 was more partially mixed (right below). • Site 1 is well-mixed due to strong tidal currents and wind circulation distribution.
Observations and Explanation • Dissolved Oxygen was similar within each site as far as depth and was similar within the different sites. • Dissolved Oxygen probably varies with season, but not with different sites. • As water temperature rises, dissolved oxygen decreases. • Freshwater inflow, nutrients, winds, and water temperature are all important factors of the amount of dissolved oxygen in the estuary. However, these factors were not that different within sites so they should all be similar.
Nitrate vs. Phosphate • Phosphate and Nitrate are most likely to influence algae growth. • At site 2, there was a concentration of phosphate in the water at 1.5542 ppm. • At site 3, there was a concentration of nitrate in the water at 1.8362 ppm. • These numbers are quite low and are natural to keep algae growth regular. • If the numbers are high, these two nutrients may come from run off from farms, fertilized yards, etc.
pH • Note: Different data was collected with different groups etc so is not consistent with depths.
Observations and Explanation - pH is used to see how acidic or basic something is • pH was the highest at Site 1 and the lowest at Site 3 • pH is typically is lower near the open ocean and higher near the closed in estuaries. • This could be because: • When seawater mixes with freshwater, pH decreases. However, freshwater has a much higher pH if it evaporates to the same salinity with the seawater. Therefore, since there is more freshwater at Site 3, the pH is higher. • Photosynthesis takes place more at site 3 because there are more plant-like organisms living there than at site 1. This also causes pH to be a little higher.
Deep Water Hypothetical • If it was at this latitude and longitude setting: • Salinity would be higher since there is no freshwater mixed in. It would be more around 36 ppt. • Surface temperatures will vary due to season. However, the deep ocean will probably stay cooler since it is not affected by the sun. • Dissolved Oxygen will decrease and then start increasing again around 800 m deep. • Nitrate and Phosphate are still a necessary component to the ocean. They are still present in very low numbers. • pH would probably stay the same. Open ocean seawater typically ranges between 7.5 and 8.5.
Deep Water Hypothetical cont. • The benthic organisms that depend on photosynthesis such as algae will not survive in the deep ocean because they are not getting enough sunlight. They stay in shallow areas. • However, benthic “animals” will be found at all depths so there would be some at this depth. • Plankton and Neckton of all types and the same as we found should be at this spot too.
Other Fun things we did While out for the day collecting data • Explored a Barrier Island • Ate lunch on an island • Walked on a Mud Flat
Why Did We Do This? • By going out and collecting the data hands on • we took responsibility • We have more of a fundamental grasp of characteristics of estuaries rather than having a worksheet of data • We can observe and then identify relationships between geological, marine, and chemical characteristics within the ocean. • We had fun!
What Did I Learn? • There is a relationship between the type of sediment and the kinds of benthic organisms that can live there. • Salinity, Temperature, Dissolved Oxygen, and pH are all interrelated. • Nitrate and Phosphate are necessary at low levels to keep algae to a regular level. • How to use all sorts of instruments and tools. • Hands on experiments are MUCH better than other research reports!