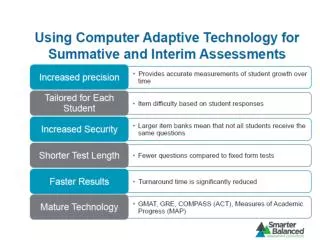
Enhancing Design Success and Productivity: A Data-Driven Approach
This article explores how to improve design success and productivity in the ever-evolving field of electronics design. It discusses the challenges related to complexity, design process, and tools, advocating for a data-centric approach to measurement and improvement. By collecting and analyzing detailed data throughout the design process, teams can diagnose issues accurately and make informed decisions, ultimately leading to more successful projects. The benefits of this methodology range from resource projections to efficient communications and reproducibility. Through standardized data collection and analysis, the article proposes a schema for tracking design metrics and enhancing benchmarking practices. Initial steps include establishing a data repository, instrumenting the design process, and collaborating with EDA vendors and other stakeholders. By focusing on data-driven insights and continuous improvement, design teams can navigate complexity more effectively and increase their chances of project success.

Enhancing Design Success and Productivity: A Data-Driven Approach
E N D
Presentation Transcript
Measure, Then Improve Andrew B. Kahng April 9, 1999
What do we want to improve? • Profits • = Design success (TT$) ? • = Design capability (design technology + mfg technology) ? • = Design process ? • = Designer productivity ? • = CAD tools ? • what is the $ value of a “better” scheduler, mapper, placer, … ? • what is the $ value of GUI, usability, … ? • Improving individual CAD tools is probably not the answer
What is the problem? • Complexity • ability to make silicon has outpaced ability to design it • complexity of data, system interactions • SOC • more functionality and customization, in less time • design at higher levels of abstraction, reuse existing design components • customized circuitry must be developed predictably, with less risk • Key question: “Will the project succeed, i.e., finish on schedule, under budget, while meeting performance goals?” • SOC design requires an organized, optimized design process
What is the design process? • Not like any “flow/methodology” bubble chart • backs of envelopes, budgeting wars • changed specs, silent decisions, e-mails, lunch discussions • ad hoc assignments of people, tools to meet current needs • proprietary databases, incompatible scripts/tools, platform-dependent GUIs, lack of usable standards • design managers operate on intuition, engineers focus on tool shortcomings • Why did it fail? • “CAD tools” • “inexperienced engineers” • Must measure to diagnose, and diagnose to improve
What should be measured? • We don’t have a clue • running a tool with wrong options, wrong subset of standard • bug in a translator/reader • assignment of junior designer to project with multiple clocks • difference between 300MHz and 200MHz in the spec • changing an 18-bit adder into a 28-bit adder midstream • decision to use domino in critical paths • one group stops attending budget/floorplan meetings • Solution: record everything, then mine the data
Design process data collection • What revision of what block was what tool called on? • by whom? • when? • how many times ? with what keystrokes ? • What happened within the tool as it ran ? • what was CPU/memory/solution quality ? • what were the key attributes of the instance ? • what iterations / branches were made, under what conditions ? • What else was occurring in the project ? • e-mails, spec revisions, constraint and netlist changes, … • Everything is fair game; bound only by server bandwidth
Example diagnoses • User performs same operation repeatedly with nearly identical inputs • tool is not acting as expected • solution quality is poor, and knobs are being twiddled • Email traffic in a project: • missed deadline, revised deadline; disengagement; project failed • Infinite possibilities! (and lots of interesting research…) traffic time
Benefits to project management • Resource projections before projects start • go / no go at earliest point • Accurate project post-mortems • everything was tracked: tools, flows, communications, changes • optimize next project based on past results • no data or information “loose” at project end • Less wasted resources • recover from bad runs (don’t make same mistakes twice) • prevent out of sync runs • no duplication of data / effort • R&D playground differentiated from Design • Efficient communications: email templates, auto-advisors... • Reproducibility: software assembly line science, not art
Benefits to tools R&D • Methodology for continuous tracking data over entire lifecycle of instrumented tools • More efficient analysis of realistic data • no need to rely only on extrapolations of tiny artificial “benchmarks” • no need to collect source files for test cases, and re-run in house • Facilitates identification of key design metrics, effects on tools • standardized vocabulary, schema for design/instance attributes • cf. Fujitsu CSI ? • Improves benchmarking • apples to apples, and what are the apples in the first place • apples to oranges as well, given enough correlation research
First steps • Schema for information within the design process • Repository for this information • data warehouse, APIs, ... • Instrument a design process and collect real data • scripts around existing reports / logfiles • new releases of tools that are compliant with metrics schema • possible initial scope: RTL to layout (Fabrics) • candidates: EDA vendors, GSRC tool research, design driver projects • (cf. LSIL, IP Symphony, Semicustom Highway, …) • Data mining and data visualization tools • We should outsource most of the above, and concentrate on the mining, diagnosis, metrics definition
Schema fragments (placement) • Basic • runtime, peak memory, HPWL/RSMT, partitioner/analytic placer traces, timing/noise estimates, resynthesis ops • technology, layer stack, site map, cell library EEQ/LEQ flexibility, porosity measures, power distribution scheme, current delivery capability, ... • Hierarchy-related • how repeaters treated in hierarchy, spare methodology • for each node: hierarchy level, xtor count, layout area, node’s placed bounding box, fanout, ... • for each net: timing budget/slack, LCA in hierarchy, route controls, membership in bus, … • Routability • congestion, pin density, cell density, crossing, ...
Recall: Optimization/Prediction • We need: • most relevant formulations and objectives • most relevant parameters of an instance • most relvant models of optimization heuristics (i.e., tools) • what should be passed down/up/between tools • bookshelf of formulations, interfaces, evaluators, … • culture change: standards for reporting/comparison, lower barriers to entry for research • Metrics implicitly gives all of these ?!
Manufacturability metrics • Impact of mfg on design productivity • Inter- and intra-die variation • Topography effects • Impact, tradeoffs of newer lithography techniques and materials • What is the appropriate abstraction of manufacturing process for design?
Potential research: new metrics • Tools: • scope of applicability • predictability • usability • Designs: • difficulty of design or manufacturing • verifiability, debuggability/probe-ability • likelihood of a bug escape • $ cost (function of design effort, integratability, migratability, …) • Statistical metrics, time-varying metrics • Key areas: • T1-T2 interface • T2-T3 interface
Other potential outcomes • Techniques for optimizing design processes • New measures of design value (as opposed to cost) • what should be the price of a design? • Meta-result: documentation and measurement of GSRC’s impact on the system design process • Metrics repository is the design repository ? • Summary: Record it, Mine it, Measure it, Diagnose it, … Then Improve it