Measure
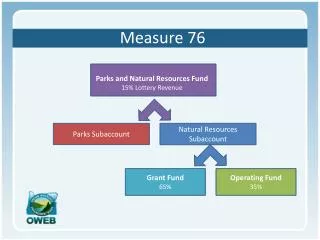
Measure. Module 2.1 Determine What to Measure. Performance Measures – Customer Value Achieved?. Critical Customer Requirements. Market. Suppliers. Process Inputs. Business Processes. Process Outputs. Output Performance Measures. Input Measures. Process Measures.


Measure
E N D
Presentation Transcript
Measure Module 2.1 Determine What to Measure
Performance Measures – Customer Value Achieved? Critical Customer Requirements Market Suppliers Process Inputs Business Processes Process Outputs Output Performance Measures Input Measures Process Measures Important decisions based on linking customer expectations to process performance Customer Value
Critical Customer Requirements Critical to the Process Input, Process, and Output Indicators Input Indicators Process Indicators Output Performance Indicators • Cost per transaction • Time per activity • Amount of rework • Turnaround time • Variability of an activity • Percent defective • Number of errors • Total response time • Invoice/billing accuracy • Revenue • # of customer inquiries • Type of customer inquiries • # of orders • # of positions open • Type of position open • Accuracy of the credit analysis • Timeliness of the contract submitted for review These should all appear on your process map
Measure Module 2.3 Manage Measurement
Identify Measures Step 1 Develop operational definitions for measure Step 2 Develop measurement plan Step 3 Collect data Step 4 Display and Evaluate data Data Collection Measurement management starts with a data collection methodology.
Before data collections starts, classify the data into different types: continuous or discrete. This is important because it will: Provide a choice of data display and analysis tools Dictate sample size calculation Provide performance or cause information Determine the appropriate control chart to use Determine the appropriate method for calculation of Sigma Two Basic Types of Data Continuous or variable Discrete, categorical, or attribute Measured on a continuum Count or categories • Subjective • Yes/No • Categories • Service performance rating (good, poor) • Satisfaction • Agreement • Objective • Time • Money • Weight • Length • Subjective • Satisfaction • Agreement • Extent • Type of error • Objective • Count defects • # approved • # of errors • Type of document
Step 1: Operational Definition An operational definition is a concept that helps guide the team’s thinking on what they need to measure as well as the key attributes of the measure: what, how, and who. It provides the foundation for the team to reach agreement and build consistency and reliability into data collection. This helps ensure any person using the agreed-on definition will be measuring the same thing. Provides everybody with the same meaning. Ensures that consistency and reliability are built in up front. Describes the scope of the measure (what is included and what is not included). Step 1: Develop Operational Definitions
Step 2: Develop a Measurement Plan Each 6 Sigma improvement team should complete a measurement plan that contains the following information: Example: Cycle time for loan application processing • Considerations for other data that should be collected at the same time: • How will you display the data? • What do you want to do with the data after it is collected? • How do you want to stratify the data? • What data might you need to identify and verify root cause? • Data collection is a balance between time, money and accuracy (getting the data you need).
Step 2: Develop a Measurement Plan Example: Industrial Pre-Treat Cost Reduction
Measure Module 2.6 Gage R&R
Consider the reasons why we measure: Why Worry about Measurement Variation? Verify product/process conformity to specifications Assist incontinuous improvement activities How might measurement variation affect these decisions? What if the amount of measurement variation is unknown ? Process Process Measurement Measurement Measurement variation can make our process capabilities appear worse than they are
The Importance of Measurement System Analysis (MSA) • Is the importance of conducting an MSA being overlooked? • Many resources can be wasted trying to improve a process when a major source of variability is the measurement system • More consideration needs to be given to the measurement system before beginning process improvement work • The measurement system is only one source of variability when measuring a product or process • The purpose of a measurement system is to better understand the sources of variation that can influence the results produced by the process under investigation
Product Variability (Actual variability) Measurement Variability Total Variability (Observed variability) Sources of Variation Total Observed Variation Actual Product/Process Variation Measurement Variation Common cause variation Special cause Variation Within part variation Variation due to Gage Variation due to Operator
The sources of variability for the measurement system are: Components of Measurement Error Generally recognized criteria for gage acceptability is when Gage R& R variability yields: Under 10%: Acceptable gage 10% to 30%: May be acceptable Over 30%: Gage is unacceptable and should be corrected or replaced Gage R&R is the percentage of the total process variation related to the measurement system for repeatability and reproducibility
Step 3: Collect Data • Follow the plan — note any deviations from the plan • Consistency — avoid bias • Observe data collection Does anyone have any experience of data collection?
Sampling From a Population Entire Population of Data Parameters: m, s Sample Analysis Statistical Inference Statistics: X, S, etc. Sampling Using a sample of data you draw conclusions about the entire population of data. This is known as “statistical inference.” Sampling saves costs and time. Sampling provides a good alternative to collecting all the data. Identifying a specific confidence level allows us to make reasonable business decisions.
Systematic Process Sampling X X X X X X Sample Typical Descriptive Statistics: Average cycle time (xbar) No. of defects proportion defective standard deviation (s) X X X X Sample Random Sampling from a Population X X X X Systematic Process Sampling • Different situations which dictate sampling techniques: • To analyze and control a process • To describe a large population (i.e., types of customers and buying behavior)
Where Location in the process where process steps directly affect outputs (strong relationship) Maximize opportunity for problem identification (cause data) Frequency Dependent on volume of transactions and/or activity Unstable process—more frequently (use systematic or subgroup sampling) Stable process—less frequently (use sample size formula) Dependent on how precise the measurement must be to make a meaningful business decision Considerations Is the sample representative of the process or population? Is the process stable? Is the sample random? Is there an equal probability of selecting any data point? The answer to each of these questions must be yes before we can draw statistically valid conclusions. Sampling Considerations
Step 4: Display & Evaluate Data • Has your data collection method: • given you dependable data? • provided consistent information throughout the data collection period? • provided a reliable set of data? • given representative data? • If you repeat the data collection will you get similar results? • Does the data collected provide the information you need?
Measure Module 2.4 Control Charts
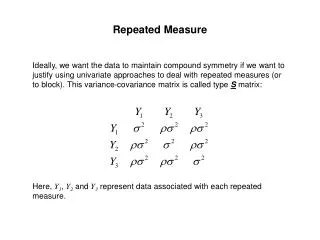
Variation means that a process does not produce exactly the same result every time the product or service is delivered Variation exists in all processes Measuring and understanding variation in our business processes helps identify specifically what the current level of performance is and what needs to change in order to reduce the variability and therefore reduce the defects delivered to customers Variation Data Variation
Common Cause Variation • There are always inherent chance causes responsible for natural variation in all processes due to “normal” variation in materials, environments, methods, etc. (common cause) • Variation within a stable pattern of chance causes is inevitable
Special Cause Variation • Once we have an indication of a shift outside a stable pattern of variation, we must discover the reason for the shift (special cause) • We want to remove the influence of a special cause if it is adversely affecting product-process quality • If the special cause influence is improving product-process quality (e.g., 6 Sigma projects), we want to permanently capture its effect
Critical Customer Requirements Market Suppliers Process Inputs Business Process Process Outputs Defects Root cause analysis of variation leads to permanent defect reduction Variation in the output of processes causes defects What Causes Variation?
UCL Commuting Time (mins) CL LCL Days Charting Variation – Control Charts
Control Charts - Basics Control charts • Have the ability to indicate the presence of special causes that upset our processes • Help us to detect, diagnose, and correct process problems in a timely fashion • Provide an easy to understand visual indicator of process performance
Reacting to Data/Tweaking Establish Baseline Control Charts • Recognize the extent of variation that now exists so that we do not overreact to common cause variation (tweaking) • Study the process to identify sources of variation and then act to eliminate or reduce those sources of variation or to mitigate their effects • Special causes can be identified with an effective diagnostic program • Common causes could not be removed or drastically reduced without making fundamental process changes
Reacting to Data/Tweaking Normal Reacting To Data Tweaking Tweaking
Measure Module 2.7 Process Capability
Process Capability – What is it? Quantifiable comparison of Voice of the Customer(spec limits) to Voice of the Process (control limits) • Most measures have some target value and acceptable limits of variation around the target • The extent to which the “expected” values fall within these limits determines how capable the process is of meeting its requirements • Consider key measures of process performance in: • Help desk responsiveness • Laminate flatness • Pump flow rate Variable Data
Process Capability Ratio – Cp • Ratio of total variation allowed by the specification to the total variation actually measured from the process • Typical goals for Cp are greater than 1.33 (or 1.67 for safety items) If Cp < 1, then the variability of the processis greater than the specification limits
Process Capability Ratio – Cpk • This index accounts for the dynamic mean shift in the process – the amount that the process is off target
Uses of Capability Analysis • Performed on new equipment as part of the qualification and approval process • Performed on existing processes as a means of establishing a baseline of current operations (so it’s possible to tell when improvement has occurred) • When done periodically, is a means of monitoring wear and tear on equipment, and deterioration of a process for whatever reason (material, personnel, environment, etc.) • Can be done on any process that has a spec. established, manufacturing or transactional (spec. is needed for the values in numerator), and has a capable measuring system (needed for valid values in denominator) Establish Baseline
Preparing for Capability Analysis When beginning to measure/monitor a parameter always: • Calibrate measuring system (unless done recently) • Use a standard traceable to NIST (National Institute of Standards and Technology) • One trained technician • Perform Measuring System Analysis (MSA) • Group of actual parts (use parts from the high and low ends of the tolerance range, even rejected parts) • Group of actual machine operators • Multiple ‘blind’ and random runs • The process should be statistically in-control
Impact of Quality Level on Cost Optimum Cost Sigma Costs Are Always Kept in Mind • There is an optimum quality level beyond which the costs of quality improvement exceed the expected cost savings from a reduced number of defects
90% Customer Quality OK Inspect First Pass Yield Inputs Operation NOTOK (Yield After Inspection or Test) Rework Hidden Factory Scrap Process Final Test 4 1 2 3 = 66% is not 90% ... why not? 90%Yield 90%Yield 90%Yield 90%Yield 90%Yield Rolled Yield 81 % 73 % 66 % Rolled Throughput Yield vs. First Pass Yield Using Final Test “First Pass Yield” ignores the hidden factory. Final test performance is a function of inspection/test or prevention.
Rolled Throughput Yield Example – Statement • Airtronics has a seven-step process for taking a purchase requisition and turning it into an issued Purchase Order • The seven steps have the following first pass yield rates: • Step 1: 0.981 • Step 2: 0.972 • Step 3: 0.943 • Step 4: 0.892 • Step 5: 0.943 • Step 6: 0.904 • Step 7: 0.963 • What is the Rolled Throughput Yield for this 7 Step Process?
Rolled Throughput Yield Example – Solution • The Rolled Throughput Yield for the seven step process is: Step 1 x Step 2 x Step 3 x Step 4 x Step 5 x Step 6 x Step 7 = Rolled Throughput Yield 0.981 x 0.972 x 0.943 x 0.892 x 0.943 x 0.904 x 0.963 = 0.658 • Conclusion: 66 percent of the purchase requisitions make it through the process with no errors the first time
6s 5s 4s Why 6 Sigma is the Goal Rolled Throughput Yield (RTY)is the probability that a product will pass through the entire process without rework and without any defects. If you have a complex product and/or process, 6 sigma yield will be needed at each process step or for each part in order to have RTY of greater than 90 percent.
Measure Module 2.5 Week 1 Financials* • Note: This module is for Caterpillar internal use, so this may not be applicable to Caterpillar Suppliers and Dealers. Please check with your company Deployment Champion regarding this subject.
Why We Measure - Recipe for Success CSF: Quantifiable Measures & Results: 6 Sigma projects should be designed to pay their way… Quantifiable benefits must be traceable to the enterprise bottom line Business Business Process Process Framework Framework Customer Customer Quantifiable Quantifiable & & Measures Measures Market Market & Results & Results Network Network Committed Committed Committed Committed Leadership Leadership Leadership Leadership Incentives Incentives & & Strategy Strategy Accountability Accountability Integration Integration Full Time Full Time 6 Sigma 6 Sigma Team Team Leaders Leaders
Why We Measure the Financial Impact • Primary reason is to ensure financial benefits from projects are real…validates success and establishes credibility • What gets measured, gets done • Drives bottom-line focus • Forces value-add mind set • Facilitates filtering and prioritization of projects
Establishing the Financial Baseline • Baselines reflect the current “as-is” state of the process • Current revenue or cost structure • Use budgetary approach • Not Business Plan or Prior Year Base Period • Determine the ENTERPRISE resources consumed at each step of the process • Head count, material, overtime, external charges (contracts, etc.), expediting charges, etc.