Download

1 / 8
80 likes | 173 Views
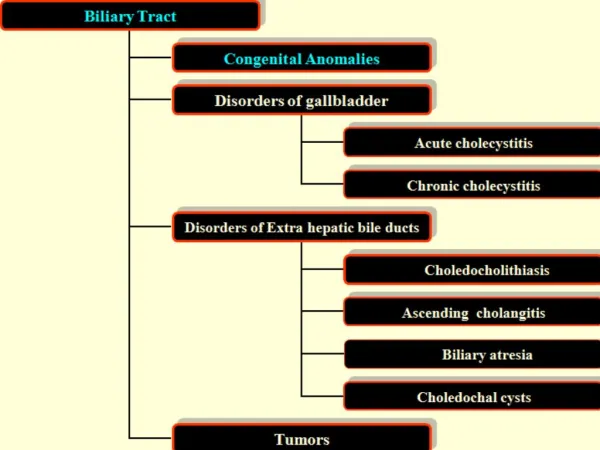
Investigate neighbor pairs in human and mouse liver with distance ≤ 10k. Significant trends observed in PC-NC and PC-PC neighbor pairs. Comparative analysis reveals insights into expressed neighbor genes.

E N D
Neighbors with Distance ≤ 10k • Neighbor pairs, significant trending observed: χ2 p-value 1.146e-13 At least one neighbor per pair must be considered expressed; 4033 pairs analyzed
Neighbors with Distance ≤ 10k • PC-NC • PC-PC Percents are of all clustered neighbor pairs. PC-NC appears to get more neighbors than PC-PC.
Neighbors with Distance ≤ 10k • PC-PC Neighbors, significant trending observed: χ2 p-value 1.706e-08 At least one neighbor per pair must be considered expressed; 3434 pairs analyzed
Neighbors with Distance ≤ 10k • PC-NC • PC-PC
Intronic, intergenic NC neighbors have ~ same distributions, so combined distribution is shown.
2658 PC genes with one and only one PC NN < 10k, NC NN < 10k each; but only 527 with one expressed.