Introduction to Data visualization
Know about data visualization in details. Find why it is important and the technology behind it.

Introduction to Data visualization
E N D
Presentation Transcript
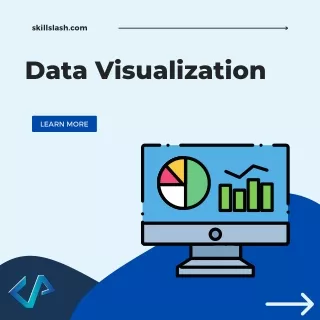
skillslash.com Data Visualization LEARN MORE
SUB-TOPIC 1 WHAT IS DATA VISUALIZATION? 2 WHY IS IT IMPORTANT? 3 POPULAR VISUALIZATION TECHNIQUES 4 SCIENCE BEHIND VISUALIZATION 5 DATA VISUALIZATION TOOLS 6 CAREER IN DATA VISUALIZATION
WHAT IS DATA VISUALIZATION? It is a way of converting information into visual form like Map or Graphs to pull insights easily.
WHY IS IT IMPORTANT? The ability to quickly absorb information, gain new insights, and make better decisions A better capacity to keep the audience's attention A simple means of sharing information that is understandable to everyone
POPULAR TECHNIQUES Line Chart Scatter Plot Area Chart Tree Map Population Pyramid
SCIENCE BEHIND DATA VISUALIZATION There are 2 methods System 1- Thought process that is fast and unconscious , includes our day to day task like riding a bike or solving simple maths problem System 2 - Involves slow and logical thought process like: Solving complex problem, Learning a phone number
DATA VISUALIZATION TOOL Tableau Zoho Analytics MS PowerBI Looker Sisense IBM Cognos Analytics
CAREER IN DATA VISUALIZATION It is used in every field. Few of the top fields are: Sales & Marketing Healthcare Finance Logistics Scientist Data science & research
Thanks! We are so lucky to have amazing supporters like you. NEXT TOPIC: How Data Visualization is used in Marketing To learn more, consider following! @SKILLSLASH skillslash.com