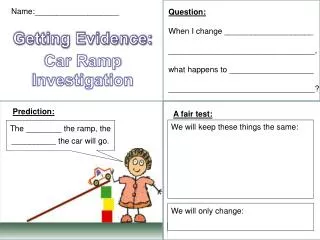
THE HASI
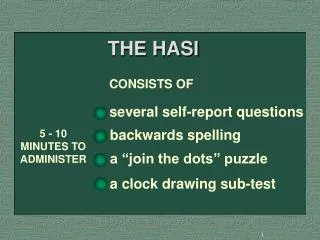
THE HASI. 5 - 10 MINUTES TO ADMINISTER. CONSISTS OF. backwards spelling. several self-report questions. a “join the dots” puzzle. a clock drawing sub-test. Gender. Under 18. Over 18. Total. 133 23.5%. 423 74.8%. 291 51.3%. Male. 28 4.9%. 115 20.3%. 143 25.2%. Female.

THE HASI
E N D
Presentation Transcript
THE HASI • 5 - 10 MINUTES TO ADMINISTER CONSISTS OF backwards spelling several self-report questions a “join the dots” puzzle a clock drawing sub-test
Gender Under 18 Over 18 Total 133 23.5% 423 74.8% 291 51.3% Male 28 4.9% 115 20.3% 143 25.2% Female 161 28.4% 406 71.6% 567 100.0% TOTAL Table 1 Gender and age of participants
Prevalence of intellectual disability in the study population • SS<70 on KBIT or VABS • Total Sample: • 17.4% below 70 on KBIT • 27.8% on the VABS • In under-18 group: • 16.2% below 70 on KBIT • 28.0% on VABS • No significant difference between juvenile and adult offenders
Indigenous Status Standard Deviation Test N Mean KBIT Composite SS Not indigenous Indigenous 189 114 87.29* 81.31 16.74 15.80 Vineland Composite SS Not indigenous Indigenous 205 120 83.37** 76.88 21.27 18.18 Table 2 Standard scores for indigenous and non-indigenous groups * p<.002 **p<.005
Figure 1 Using the HASI to screen for intellectual disability - total sample 100 80 60 40 Sensitivity Sensitivity 20 0 0 20 40 60 80 100 Specificity Specificity Area under ROC curve .870
Figure 2 Comparison of HASI and VABS in predicting KBIT results - total sample HASI VABS SS 100 80 60 Sensitivity 40 20 0 0 20 40 60 80 100 Specificity
Figure 3 Comparison of HASI and KBIT in predicting VABS HASI KBIT TOT SS 100 80 60 Sensitivity 40 20 0 0 20 40 60 80 100 Specificity
Figure 4 Comparison of HASI and VABS in predicting KBIT in indigenous sample HASI VABS SS 100 80 60 Sensitivity 40 20 0 0 20 40 60 80 100 Specificity
Figure 5 Comparison of HASI and KBIT in predicting VABS - indigenous group HASI KBIT TOT SS 100 80 60 Sensitivity 40 20 0 0 20 40 60 80 100 Specificity
Correlations between the HASI, and KBIT and VABS • Correlations were significant (0.01 or 0.05) for - • Adult males • Adult females • Under 18s • Indigenous, including Aboriginal, Torres Strait Islander, Maori and Pacific Islander • Aboriginal and Torres Strait Islander (ATSI) only - adults and juveniles • The only non-significant correlation was between HASI and VABS scores for juvenile ATSI
Future directions • Further development to increase culture-fairness • Trial in hospital emergency rooms, assessing competence • Possible use by social security agencies • Possible use in adolescent mental health agencies • “The overwhelming over-representation in corrective services and juvenile justice is a powerful argument for the need for increased investment in early childhood intervention” • (NSW Parliamentary Standing Committee on Law and Justice, 1999)