Download
1 / 26
260 likes | 426 Views
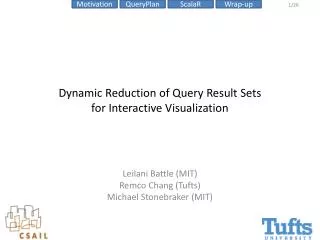
Dynamic Reduction of Query Result Sets for Interactive Visualization. Leilani Battle (MIT) Remco Chang (Tufts) Michael Stonebraker (MIT). Context. Visualization System. query. result. Database. Problems with Most VIS Systems. Scalability

E N D
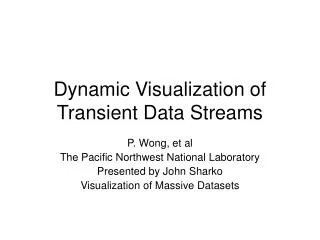
Dynamic Reduction of Query Result Sets for Interactive Visualization Leilani Battle (MIT) Remco Chang (Tufts) Michael Stonebraker (MIT)
Context Visualization System query result Database
Problems with Most VIS Systems • Scalability • Most InfoVis systems assume that memory stay in-core • Out-of-core systems assume locality and/or structure in data (e.g. grid). • Database-driven systems leverage operations specific to the application (e.g. column-store for business analytics) • Over-plotting • Makes visualizations unreadable • Waste of time/resources
The Problem We Want to Solve Large Data in a Data Warehouse Visualization on a Commodity Hardware
Apporach: Trading Accuracy For Speed • In the Vis community • Common practice, e.g. • Based on Data: Elmqvist and Fekete (TVCG, ’10) • Based on Display: Jerding and Stasko (TVCG, ‘98) • In the Database community • Less common, e.g. • Stratified Sampling: Chaudhuri et al. (TOD, ’07) • (BlinkDB) Bounded Errors and Response Time: Agarwal et al. (Eurosys ‘13) • Online Aggregation: Hellerstein et al. (SIGMOD ‘97), Fisher et al. (CHI ‘12)
Our Solution: Resolution Reduction Visualization System query Resolution Reduction Layer queryplan query modified query queryplan result reduced result Database
Our Implementation: ScalaR • Back-end database: SciDB • An array-based database for scientific data • Front-end visualization: javascript + D3 • Middleware: • Named ScalaR • Written as a web-server plugin • “Traps” queries from the front-end and communicates with the back-end
Query Plan and Query Optimizer • (Almost) All database systems have a query compiler • Responsible for parsing, interpreting, and generating an efficient execution plan for the query • Query optimizer • Responsible for improving query performance based on (pre-computed) meta data. • Designed to be super fast • Continues to be an active area of DB research
Example Query Plan / Optimizer • Given a database with two tables: dept (dno, floor) emp(name, age, sal, dno) • Consider the following SQL query: select name, floor from employ, dept whereemploy.dno = dept.dno andemploy.sal > 100k Example taken from “Query Optimization” by Ioannidis, 1997
Cost of the Query • For a database with 100,000 employees (stored across 20,000 page files), the three query plans can have significantly different execution time (in 1997): • T1: <1 sec • T2: >1 hour • T3: ~1 day
Query Plan Exposed – SQL EXPLAIN • The “EXPLAIN” command • Exposes (some of) the computed results from the Query Optimization process • Not in SQL-92 • The results are DBMS-specific • Usage: explain select * from myTable;
Example EXPLAIN Output from SciDB • Example SciDB the output of (a query similar to) Explain SELECT * FROM earthquake [("[pPlan]: schema earthquake <datetime:datetime NULL DEFAULT null, magnitude:double NULL DEFAULT null, latitude:double NULL DEFAULT null, longitude:double NULL DEFAULT null> [x=1:6381,6381,0,y=1:6543,6543,0] bound start {1, 1} end {6381, 6543} density 1 cells 41750883 chunks 1 est_bytes 7.97442e+09 ")] The four attributes in the table ‘earthquake’ Notes that the dimensions of this array (table) is 6381x6543 This query will touch data elements from (1, 1) to (6381, 6543), totaling 41,750,833 cells Estimated size of the returned data is 7.97442e+09 bytes (~8GB)
Other Examples • Oracle 11g Release 1 (11.1)
Other Examples • MySQL 5.0
Other Examples • PostgreSQL 7.3.4
ScalaR with Query Plan • The front-end tells ScalaR its desired resolution • Can be based on the literal resolution of the visualization (number of pixels) • Or desired data size • Based on the query plan, ScalaR chooses one of three strategies to reduce results from the query
Reduction Strategies in ScalaR • Aggregation: • In SciDB, this operation is carried out as regrid (scale_factorX, scale_factorY) • Sampling • In SciDB, uniform sampling is carried out as bernoulli (query, percentage, randseed) • Filtering • Currently, the filtering criteria is user specified where (clause)
Example • The user launches the visualization, which shows the overview of the data • Resulting in launching the query: select latitude, longitude from quake • As shown earlier, this results in over 41 million values
Example • Based on the user’s resolution, using Aggregation, this query is modified as: selectavg(latitude), avg(longitude) from (select latitude, longitude fromquake) regrid 32, 33 • Using Sampling, this query looks like: select latitude, longitude frombernoulli(selectlatitude, longitude fromquake), 0.327, 1)
Performance Results • Dataset: NASA MODIS • Size: 2.7 Billion data points • Storage: 209GB in database (85GB compressed), across 673,380 SciDB chunks • Baseline: select * fromndsil
Benefits of ScalaR • Flexible! • Works on all visualizations and (almost) all databases • As long as the database has an EXPLAIN function • No Learning Curve! • Developers can just write regular SQL queries, and • do not have to be aware of the architecture • Adaptive! • Easily swap in a different DBMS engine, different visualization, or different rules / abilities in ScalaR. • Efficient! • The reduction strategy can be based on perceptual constraint (resolution) or data constraint (size)
Discussion • Efficient operations are still DB dependent • SciDB: good for array-based scientific data • Efficient aggregation (e.g., “regrid”) • OLAP: good for structured multidimensional data • Efficient orientation (e.g., “pivot”) • Column-Store: good for business analytics • Efficient attribute computation (e.g., “avg (column1)”) • Tuples (NoSQL), Associative (network), etc., Multi-value DB (non-1NF, no-joins), etc. • How does ScalaR know which operation to use? • One possible way is to “train” ScalaR first – give it a set of query logs (workload) to test the efficiency of different strategies
Thank you!! Leilani Battle (MIT) leibatt@mit.edu Remco Chang (Tufts) remco@cs.tufts.edu Mike Stonebraker(MIT) stonebraker@csail.mit.edu Questions?