Download
1 / 18
180 likes | 338 Views
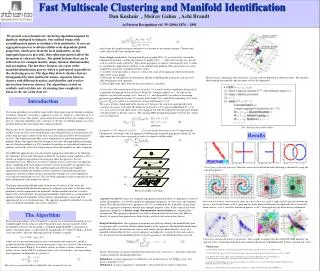
Clustering of brain tumours through constrained manifold learning using class information. Raúl Cruz and Alfredo Vellido {rcruz, avellido}@lsi.upc.edu. Contents. Introduction GTM model t-GTM model Class-tGTM Human brain tumour data Experimental results Conclusions References.

E N D
Clustering of brain tumours through constrained manifold learning using class information Raúl Cruz and Alfredo Vellido {rcruz, avellido}@lsi.upc.edu
Contents • Introduction • GTM model • t-GTM model • Class-tGTM • Human brain tumour data • Experimental results • Conclusions • References
Introduction • The cluster structure through Model-based clustering : p(X). • In classification, we model the relationship between the labels C and the data by: p(C|X). • We aim to discover the cluster structure of the data while taking into account the available class information in a semi-supervised approach.
The Generative Topographic Mapping • The GTM is a non-linear latent variable model • It defines a mapping from a latent space to the data space, generating a probability density within the latter • The GTM can be used for multivariate data visualization and clustering • It can be seen as a constrained Mixture of Distributions or as a probabilistic alternative to the Self-Organizing Map(SOM).
GTM: an illustration Image borrowed from Bishop, C.M., Svensén, M. & Williams, C.K.I., (1998) Developments of the Generative Topographic Mapping. Neurocomputing, 21(1-3)
yk uk GTM: the algorithm (1) • A regular grid of nodes uiis defined in latent space, with a prior probability: • A regular, fixed grid of non-linear basis functions provides the non-linear mapping into data space, defined by • This mapping defines a set of reference vectors in data space
Each of the reference vectors ykforms the centre of an isotropic Gaussian distribution in data space and, therefore, the data p.d.f. for the GTM model is given by: REMEMBER: The GTM can be understood as a constrained mixture of distributions. GTM: the algorithm (2)
GTM: the algorithm (3) • Given that the GTM is a parametric probability density model, it can be fitted to the data. The corresponding log-likelihood is defined as: • The EM algorithm can be used to calculate the parameters of the model
The t-GTM model • What if outliers are present in data? The use of Gaussian in standard GTM is likely to negatively bias the estimation of the adaptative parameters, distorting the clustering results. The GTM was redefined as a constrained mixture of Student t-distributions: the t-GTM (Vellido, 2006), aiming to increase the robustness of the model towards outliers.
The class-tGTM • Class separability might be improved if the clustering model accounted for the available class information. this can be achieved by modelling the joint density
Human brain tumour data • The data used in this study consist of 98 single voxel PROBE (PROton Brain Exam system) spectra acquired in vivo for five viable tumour types: astrocytomas, glioblastomas, metastases, meningiomas, and oligodendrogliomas (typology that will be used in this study as class information) and from cystic regions (associated to tumours) • A procedure based on Multivariate Bayesian Variable Selection was used elsewhere (Lee et al 2000), to describe the data set in the form of six frequency intensities, corresponding to fatty acids, lactate, a compound-unassigned peak, glutamine, choline, and taurine-inositol.
Experimental results (1) • The differences in class separability between the models with and without class information were quantified through the following entropy-like measure: where set of tumour types is the total number of tumour spectra is the number of tumour spectra assigned to the kth cluster is the number of tumour spectra from tumour type i assigned to clusterk ,
Experimental results: artificial data (2) • We used a synthetic data set, consisting of 1,200 data points, sampled from four neatly separated Gaussian distributions with centres located at and ; they were subsequently corrupted by four extra features consisting of Gaussian noise. Figure 1. Representation, on the t-GTM 2-dimensional latent space, of the synth data set described in the main text. The representation is based on the mean posterior distributions for the 1200 data points. Points belonging to each of the four original Gaussians (classes) are plotted using a different symbol. The axes of the plot are the elements of the latent vector and convey no meaning by themselves. For that reason, axes are kept unlabeled. (Left): t-GTM without class information. (Right): class-t-GTM.
Experimental results: tumour data (3) Figure 2: Cysts (circles) vs Tumour tissue Class-tGTM t-GTM Figure 3. The brain tumour MRS data set using the full tumour typology. Symbols: Cysts (circles); astrocytomas (black dots); glioblastomas (black rhombus); metastases (five-pointed stars); meningiomas (white rhombus); oligodendrogliomas (asterisks).
Experimental results (4) Table 1. Entropy results for the different models and data sets analyzed. In all cases, and for the sake of brevity, results are reported only for three values of ν (although results for other values are consistent with the reported ones). Brain simplified refers to the simplification in which data are separated into cysts versus tumour tissue, with the five tumour types reduced to a single class. Brain refers to the full tumour typology.
Conclusions and future work • Adding class information to a clustering process has the potential of improving the class separation provided by the resulting clusters. • We have clustered human brain tumour MRS data using a constrained generative model, in a variant known to behave robustly in the presence of outliers: the t-GTM. This model has been extended to account for class information in a semi-supervised manner, and experiments carried out on both synthetic and the MRS data have shown that class-t-GTM improves class discrimination. • This semi-supervised clustering modelmight also be used to visualize new and unlabelled MR spectra and infer their typology. • An alternative and perhaps more principled way to estimate the joint density would entail considering a mixture model with both Gaussian or t-Student components for the continuous data and multinomial components for the class information (binary, categorical)
References [1] M. Prastawa, E. Bullitt, S. Ho, G. Gerig, A brain tumor segmentation framework based on outlier detection, Medical Image Analysis8 (2004), 275-283. [2] C.M. Bishop, M. Svensén, C.K.I. Williams, GTM: The Generative Topographic Mapping, Neural Computation10 (1998), 215-234. [3] T. Kohonen, Self-organizing Maps, 3rd ed. Springer-Verlag, Berlin, 2000. [4] D. Peel, G.J. McLachlan, Robust mixture modelling using the t distribution, Statistics and Computing10 (2000), 339–348. [5] H.X. Wang, Q.B. Zhang, B. Luo, S. Wei, Robust mixture modelling using multivariate t-distribution with missing information, Pattern Recognition Letters25 (2004) 701–710. [6] A. Vellido, Missing data imputation through GTM as a mixture of t-distributions. Neural Networks, In press. [7] Z. Ghahramani and M.I. Jordan, Supervised learning from incomplete data via an EM approach, in J.D. Cowan, G. Tesauro, J. Alspector (eds.) Advances in Neural Information Processing Systems 6. Morgan-Kaufmann Publishers, San Francisco, CA, 120-127, 1994. [8] Y. Sun, P. Tiňo, I. Nabney, Visualization of incomplete data using class information constraints, in J. Winkler, M. Niranjan (eds.) Uncertainty in Geometric Computations, Kluwer Academic Publishers, The Netherlands, 165-174, 2002. [9] Y. Huang, P.J.G. Lisboa, W. El-Deredy, Tumour grading from Magnetic Resonance Spectroscopy: A comparison of feature extraction with variable selection, Statistics in Medicine22 (2003), 147-164.
References [10] P.J.G. Lisboa, A. Vellido, H. Wong, Outstanding issues for clinical decision support with Neural Networks, in H. Malmgren, M. Borga, L. Niklasson (eds.), Artificial Neural Networks in Medicine and Biology, Springer, London, 63-71, 2000. [11] A. Vellido, P.J.G. Lisboa, Functional topographic mapping for robust handling of outliers in brain tumour data, in M. Verleysen (ed.), Proceedings of the ESANN’05, D-Side Publications, Bruges, 133-138, 2005. [12] A. Vellido, A., P.J.G. Lisboa, Handling outliers in brain tumour MRS data analysis through robust topographic mapping, Computers in Biology and Medicine, 36(10), 1049-1063. [13] A. Vellido, A., P.J.G. Lisboa, K. Meehan, The Generative Topographic Mapping as a principled model for data visualization and market segmentation: an electronic commerce case study, International Journal of Computers, Systems, and Signals 1 (2000), 119-138. [14] Y.Y.B. Lee, Y. Huang, W. El-Deredy, P.J.G. Lisboa, C. Arus, P. Harris, Robust methodology for the discrimination of brain tumours from in vivo magnetic resonance spectra, in: IEE Proceedings of the 1st International Conference on Advances in Medical Signal and Information Processing, 88-95, 2000. [15] C.M. Bishop, M. Svensén, C.K.I. Williams, Developments of the Generative Topographic Mapping, Neurocomputing21 (1998), 203-224.