Download
1 / 39
400 likes | 582 Views
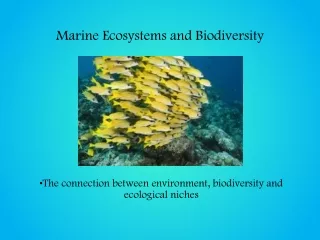
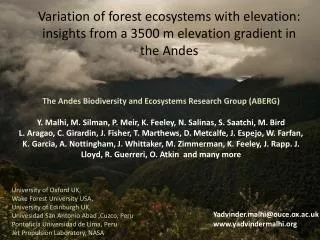
Variation of forest ecosystems with elevation: insights from a 3500 m elevation gradient in the Andes. The Andes Biodiversity and Ecosystems Research Group (ABERG) Y. Malhi, M. Silman, P. Meir, K . Feeley , N. Salinas, S. Saatchi, M. Bird

E N D
Variation of forest ecosystems with elevation: insights from a 3500 m elevation gradient in the Andes The Andes Biodiversity and Ecosystems Research Group (ABERG) Y. Malhi, M. Silman, P. Meir, K. Feeley, N. Salinas, S. Saatchi, M. Bird L. Aragao, C. Girardin, J. Fisher, T. Marthews, D. Metcalfe, J. Espejo, W. Farfan, K. Garcia, A. Nottingham, J. Whittaker, M. Zimmerman, K. Feeley, J. Rapp. J. Lloyd, R. Guerreri, O. Atkin and many more University of Oxford UK, Wake Forest University USA, University of Edinburgh UK, Univesidad San Antonio Abad ,Cuzco, Peru PontoficiaUniversidad de Lima, Peru Jet PropulsionLaboratory, NASA Yadvinder.malhi@ouce.ox.ac.uk www.yadvindermalhi.org
Talk structure Study region Plant diversity and distributions Ecosystem productivity Heterotrophic processes Plant distribution change Tree line studies
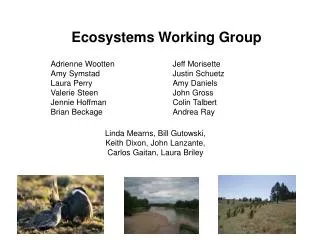
Kosñipata Valley and adjoining Amazon lowlands Andes Biodiversity and Ecosystem Research Group: www.aberg.org
200m 2000m 1250m 2250m 1750m 1000m 1500m 2500m 2750m 3000m 3250m 3450m
26.4oC 15.3oC 21oC 14.8oC 16.7oC 22.1oC 19oC 13.3oC 11.9oC 10.5oC 9.2oC 8.5oC Malhi, Y. et al (2010) Elevation gradients in the tropics: laboratories for ecosystem ecology and global change research, Global Change Biology, 16, 12, 3171-3175
Malhi, Y. et al (2010) Elevation gradients in the tropics: laboratories for ecosystem ecology and global change research, Global Change Biology, 16, 12, 3171-3175
Talk structure Study region Plant diversity and distributions Ecosystem productivity Heterotrophic processes Plant distribution change Tree line studies
Temperature and rainfall gradients 1 ha plots Trees 10cm dbh >60 ha
Tree Species Diversity Lowland levels of diversity maintained to ~1700 m * *
Most species have narrow elevation ranges Elevation (m) Tree species ranking
Talk structure Study region Plant diversity and distributions Ecosystem productivity Heterotrophic processes Plant distribution change Tree line studies
gem.tropicalforests.ox.ac.uk Measuring Tropical Forest Carbon Allocation and Cycling: A RAINFOR-GEM Field Manual for Intensive Census Plots (v2.2). Manual, Global Ecosystems Monitoring network,
NPPTotal = 15.14±0.83 NPPAG= 9.96±0.41 NPPBG= 5.18±0.72 GPP= 36.15±3.97 The carbon cycle of a forest at Tambopata. Peru NPP litterfall= 5.61±0.32 NPP herbivory = 0.76±0.05 R leaf=8.86±2.78 NPP branch turnover = 0.95±0.10 Dfine litterfall 5.61±0.32 R stem = 5.85±2.50 NPP ACW= 2.64±0.24 Rcwd Rsoil=12.98±0.82 D CWD 3.59±0.26 Rcoarseroot 1.23±0.62 R rhizosphere 5.07±0.86 NPP coarse roots = 0.51±0.05 NPP fine roots = 4.67±0.72 D root 5.18±0.72 Rsoilhet= 7.14±0.49 Malhi et al, Plant Ecology and Diversity, 2014
GPP and NPP decline with elevation but the transition is abrupt at around 16-1700 m asl (dry season cloud base)
Canopy photosynthetic capacity and leaf area index do not show a strong decline or abrupt transition with elevation Max photosynthesis under high light Leaf Area Index Once cloud immersion is factored out, autotrophic processes may have little dependence on mean temperature
Talk structure Study region Plant diversity and distributions Ecosystem productivity Heterotrophic processes Plant distribution change Tree line studies
Exploring heterotrophic processes 26.4oC 15.3oC 21oC 14.8oC 16.7oC 22.1oC 19oC 13.3oC 11.9oC 10.5oC 9.2oC 8.5oC
Translocation of root-free soil Zimmermann et al. (2010)
Large-scale leaf and woodtranslocation experiment Salinas et al. (2011) New Phytologist
Translocation experiments along the elevation gradient Leaf litter 4725 litter bags Q10 = 3.06±0.28 (r2 = 0.97, p = 0.002) Salinas et al., New Phytologist, 2011 Fine wood litter 1575 litter bags Q10 = 4.0±0.56 (r2 = 0.95, p = 0.004) Salinas et al. In review.
The sensitivity of heterotrophic decomposition is so high because soil microbial and macrofaunal communities completely change at warmer temperatures Microbial biomass increases with elevation Increased dominance of fungi relative to bacteria at high elevation Termites are only abundant in the lowlands Palin et al. (2011) Biotropica Palin et al. (2001) Biotropica Whittaker et al. (2014) Journal of Ecology
Implications under warming Autotrophic processes may be very insensitive to temperature (within the range observed) because of acclimation and community turnover Heterotrophic processes may be very sensitive to temperature because of community turnover Hence warming would be expected to increase loss of carbon from soil more than it increases gain of carbon in tree biomass
Talk structure Study region Plant diversity and distributions Ecosystem productivity Heterotrophic processes Plant distribution change Tree line studies
MIGRATION RATE (m yr-1) PLOT The mean plant community in most plots has been increasing over last 10 years by 2.0m yr-1 (+0.5 – +3.5m yr-1). Feeley et al. 2011 JBioGeo
Perú: Costa Rica: Requiredmigrationrateforclimateequilibrium MIGRATION RATE (m yr-1) +2.0m yr-1(+0.6 – +3.6m yr-1) +2.0m yr-1(+0.5 – +3.5m yr-1). Feeley, et al. 2013, Global Change Biology
Talk structure Study region Plant diversity and distributions Ecosystem productivity Heterotrophic processes Plant distribution change Tree line studies
So tree species are shifting upslope. Is the forest biome also shifting?
1963 2005
1963 2005
1963 US Air Force Recon aerial photography 1963 IKONOS satellite imagery 2005
Results: Andean timberline migration • Across study area, ~80% of timberline did not change • Upslope migration more likely in protected areas • Upslope migration rates decreased with increasing elevation • Overall migration rates far slower than required to maintain equilibrium with climate change
The Grass Ceiling? • Ecotone migration rates are 12 to 110 times slower than the observed species migration rates in our valley • Protected areas help, but management may be needed interventions are needed to assist migration
Large changes in composition with elevation DCA Axis 2
Composition and Elevation(1 ha plots) DCA Axis 1 Elevation (m)