Download

1 / 100
0 likes | 12 Views
Wendy Bergerud from the Ministry of Forests and Range discusses the importance of assessing reforested areas to predict future outcomes in forest management. Key messages include the use of TASS and TIPSY models to project volume at rotation and factors affecting volume prediction. Different types of density measurements such as total density, well-spaced density, and free-growing density are explored, emphasizing the importance of spatial distribution and site index in volume projection. Assumptions and considerations for modeling stand dynamics and projecting merchantable volume are also highlighted.

E N D
Wendy Bergerud Research Branch Ministry of Forests and Range December, 2009 1
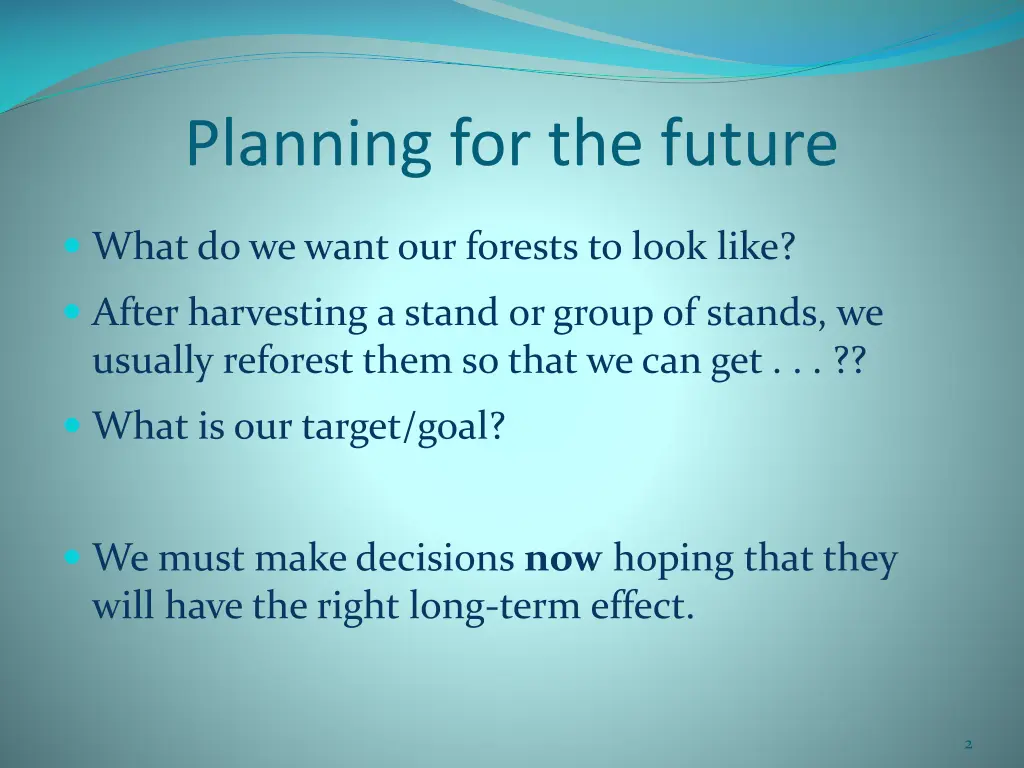
Planning for the future What do we want our forests to look like? After harvesting a stand or group of stands, we usually reforest them so that we can get . . . ?? What is our target/goal? We must make decisions now hoping that they will have the right long-term effect. 2
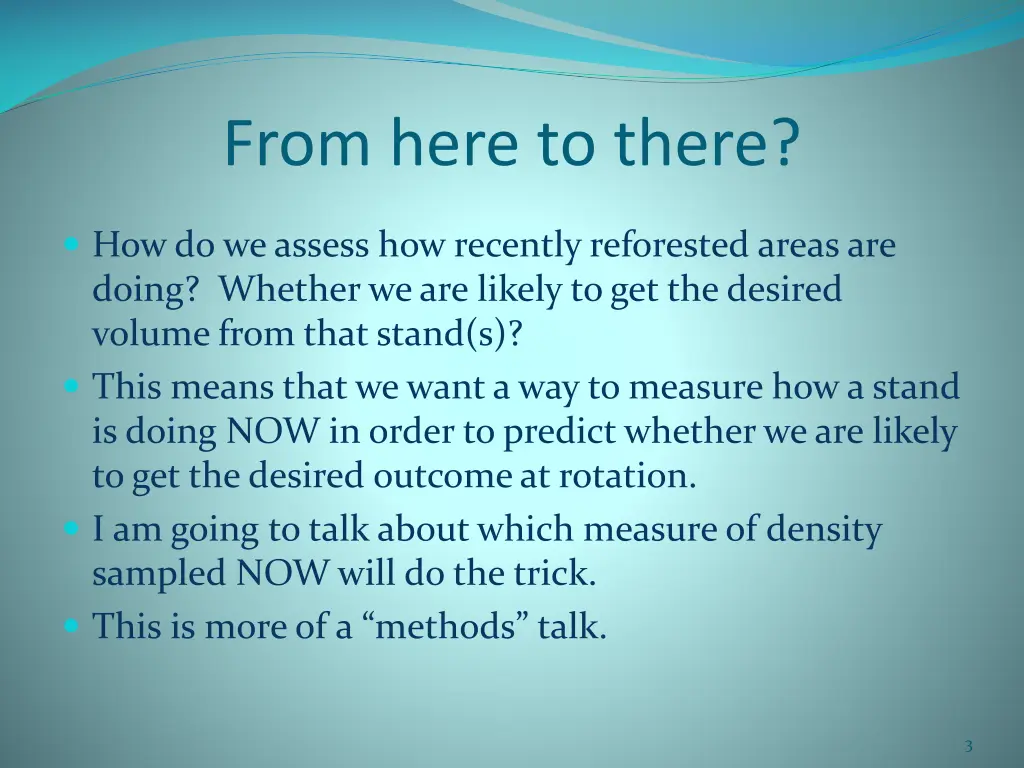
From here to there? How do we assess how recently reforested areas are doing? Whether we are likely to get the desired volume from that stand(s)? This means that we want a way to measure how a stand is doing NOW in order to predict whether we are likely to get the desired outcome at rotation. I am going to talk about which measure of density sampled NOW will do the trick. This is more of a “methods” talk. 3
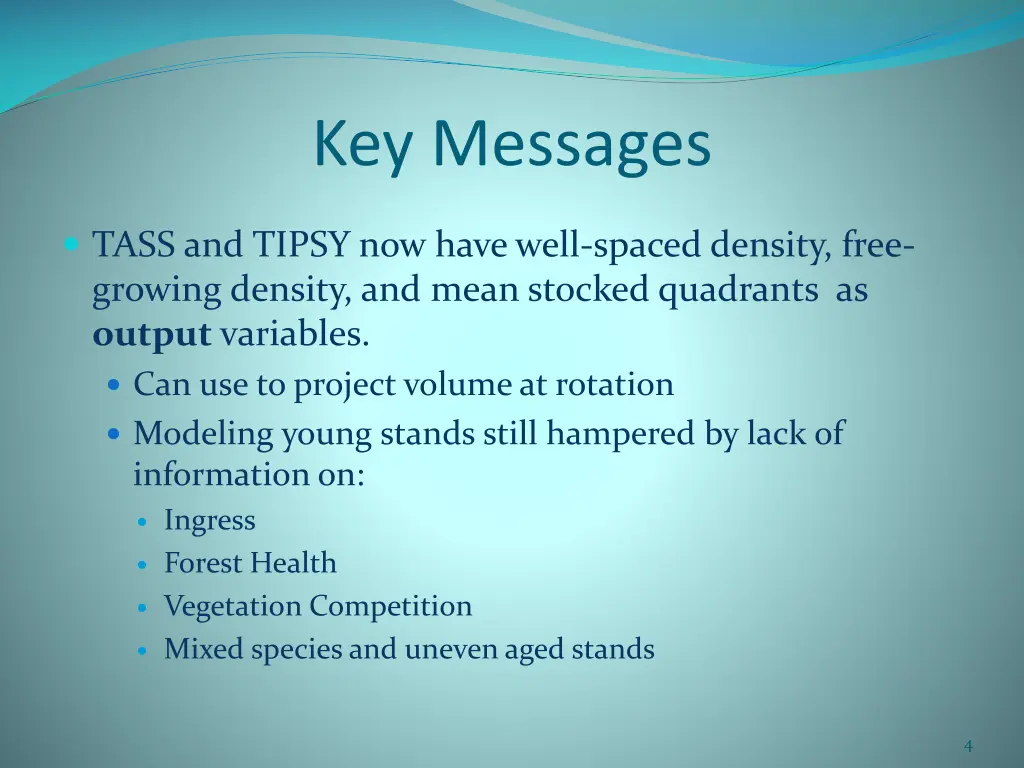
Key Messages TASS and TIPSY now have well-spaced density, free- growing density, and mean stocked quadrants as output variables. Can use to project volume at rotation Modeling young stands still hampered by lack of information on: Ingress Forest Health Vegetation Competition Mixed species and uneven aged stands 4
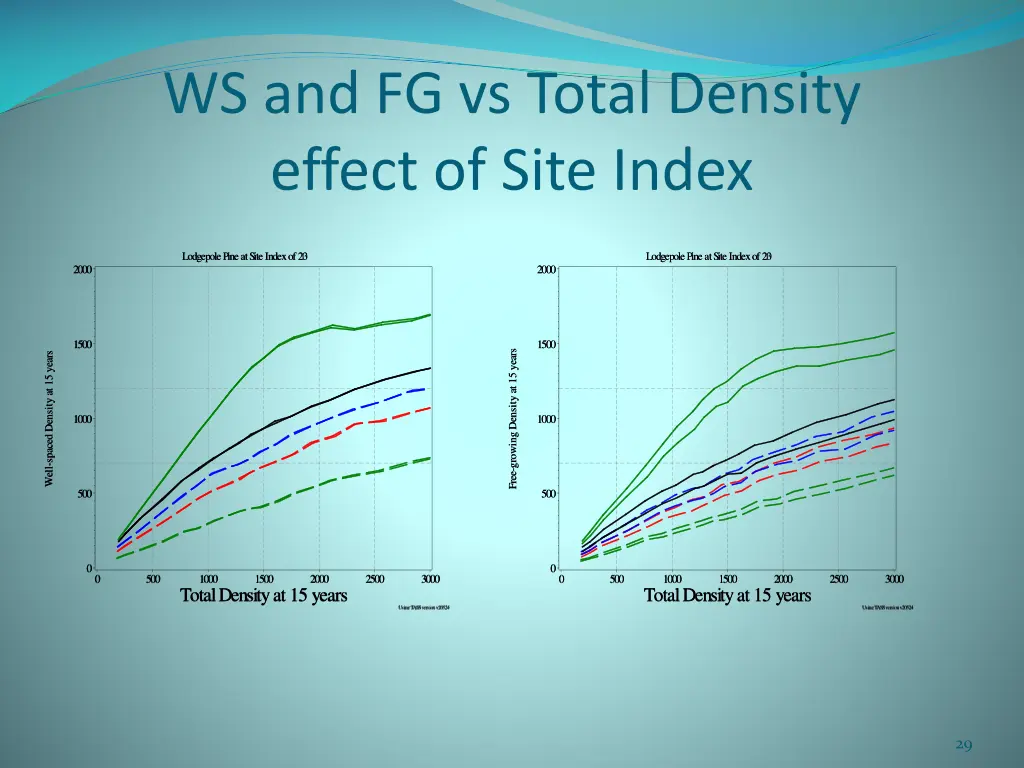
Key Messages Spatial distribution is very important when projecting volumes at rotation for current densities. So is Site Index. Under optimum conditions, well-spaced density 10 to 20 years after FG declaration should be about the same. The free-growing density might actually increase. Modeling stand dynamics with TASS and TIPSY require a good understanding of the assumptions that must be made. 5
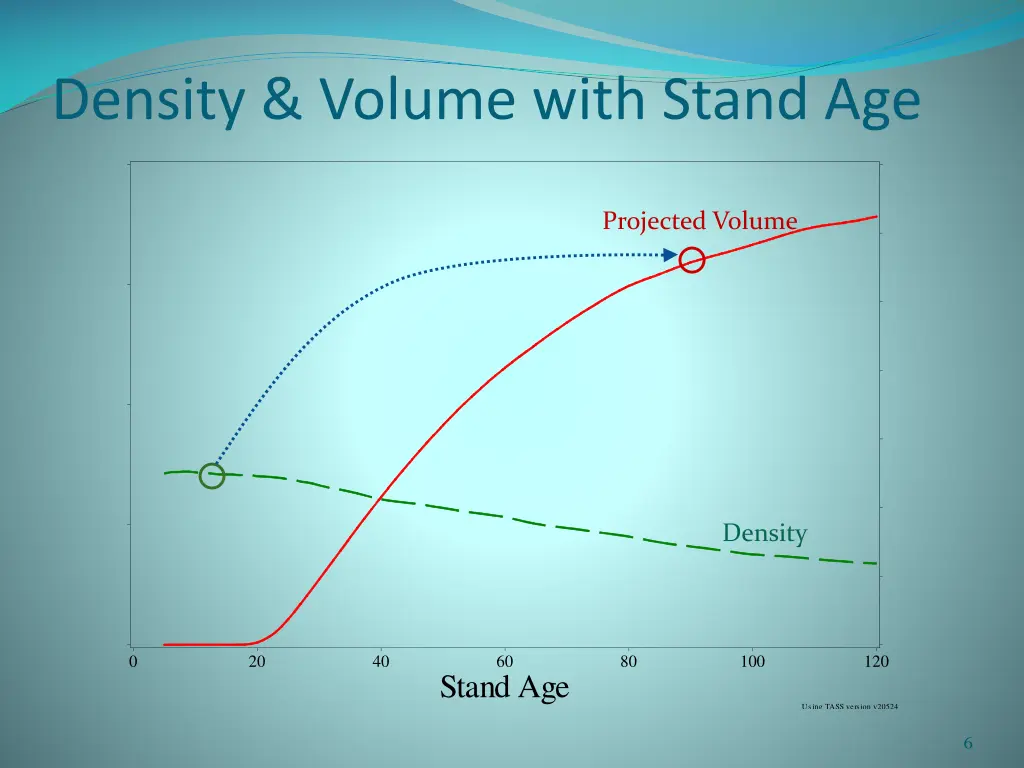
Density & Volume with Stand Age Projected Volume Density 0 20 40 60 80 100 120 Stand Age Using TASS version v20524 6
Factors affecting the prediction of projected merchantable volume as a function of density include: Species Site Index Spatial Distribution Growth Model used Health Effects Competition Unexpected events (e.g. MPB) Other factors? 7
Discussion Assumptions Spatially homogeneous, even-aged stands. No brush or competition issues No forest health issues or unexpected events No OAFs Minimum inter-tree distance (MITD) is 2.0 m Minimum height to be free-growing is 2.0 m Well-spaced and free-growing density are all “uncapped” estimates. 8
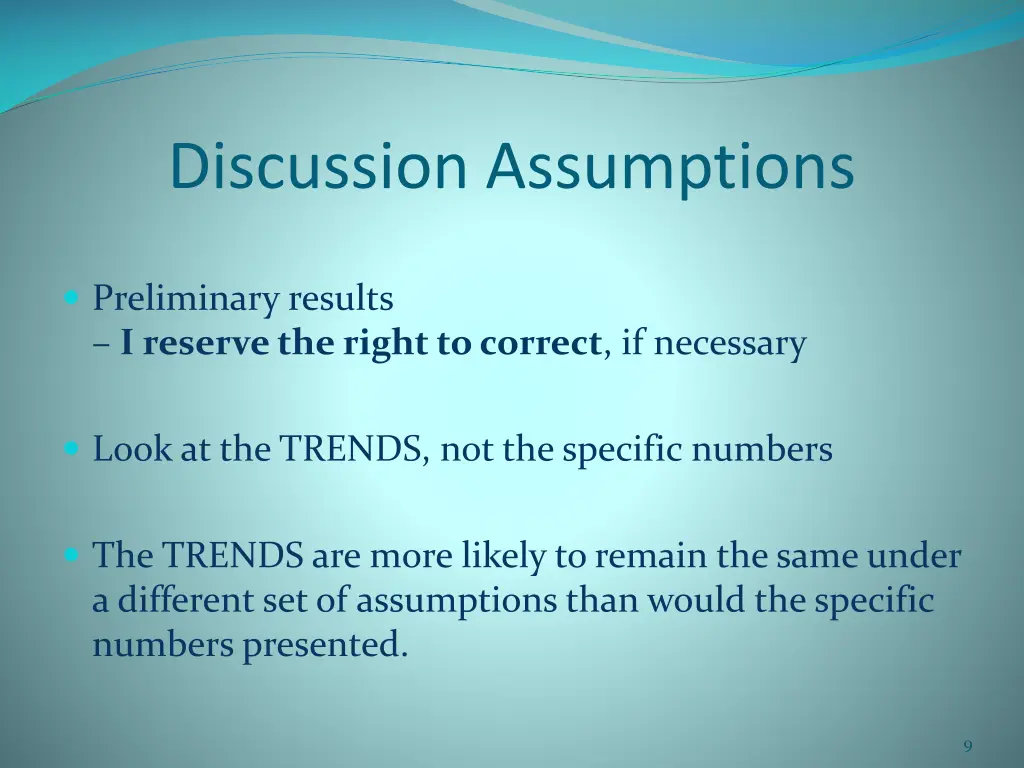
Discussion Assumptions Preliminary results – I reserve the right to correct, if necessary Look at the TRENDS, not the specific numbers The TRENDS are more likely to remain the same under a different set of assumptions than would the specific numbers presented. 9
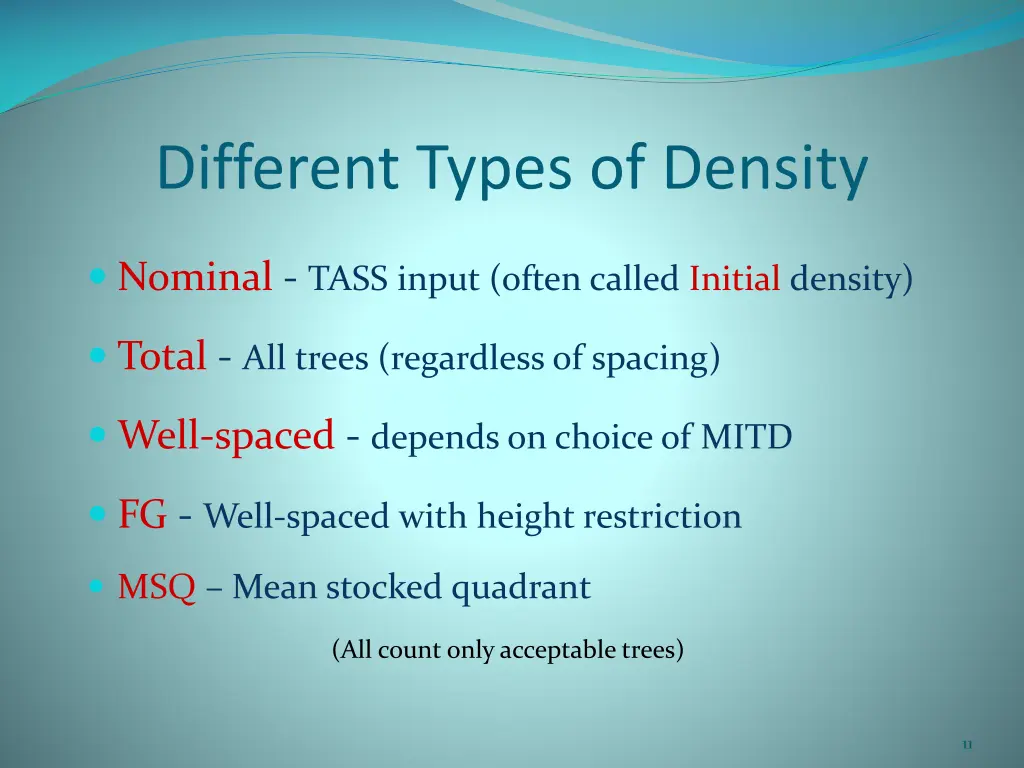
Different Types of Density Nominal - TASS input (often called Initial density) Total - All trees (regardless of spacing) Well-spaced - depends on choice of MITD FG - Well-spaced with height restriction MSQ – Mean stocked quadrant (All count only acceptable trees) 11
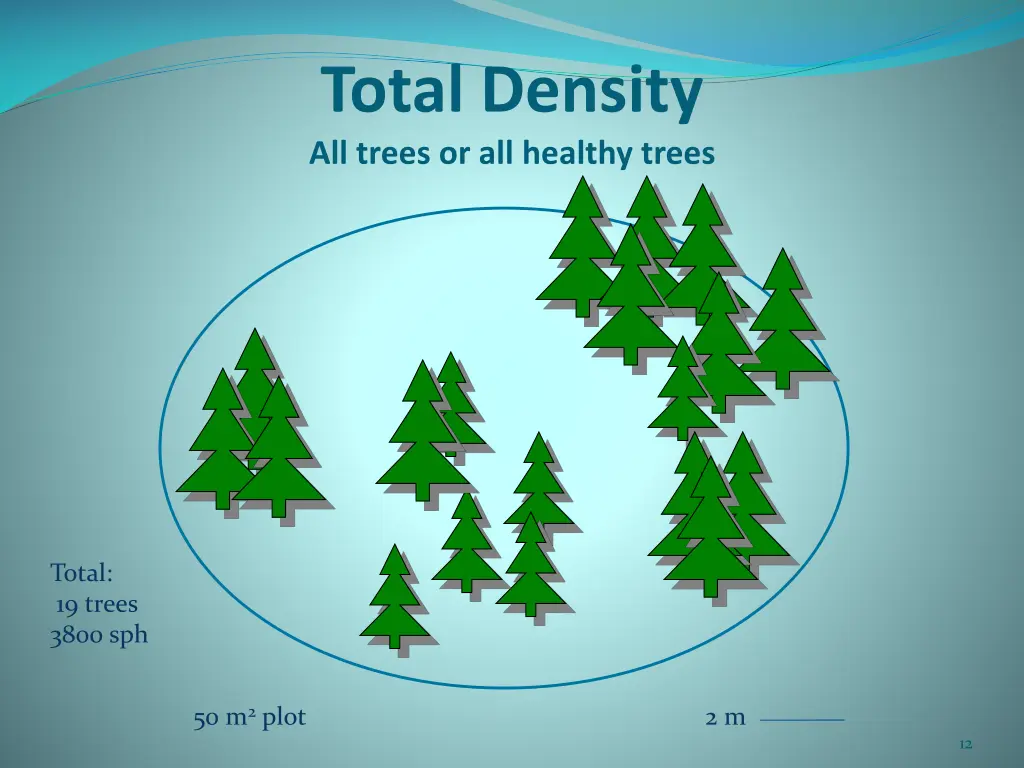
Total Density All trees or all healthy trees Total: 19 trees 3800 sph 50 m2plot 2 m 12
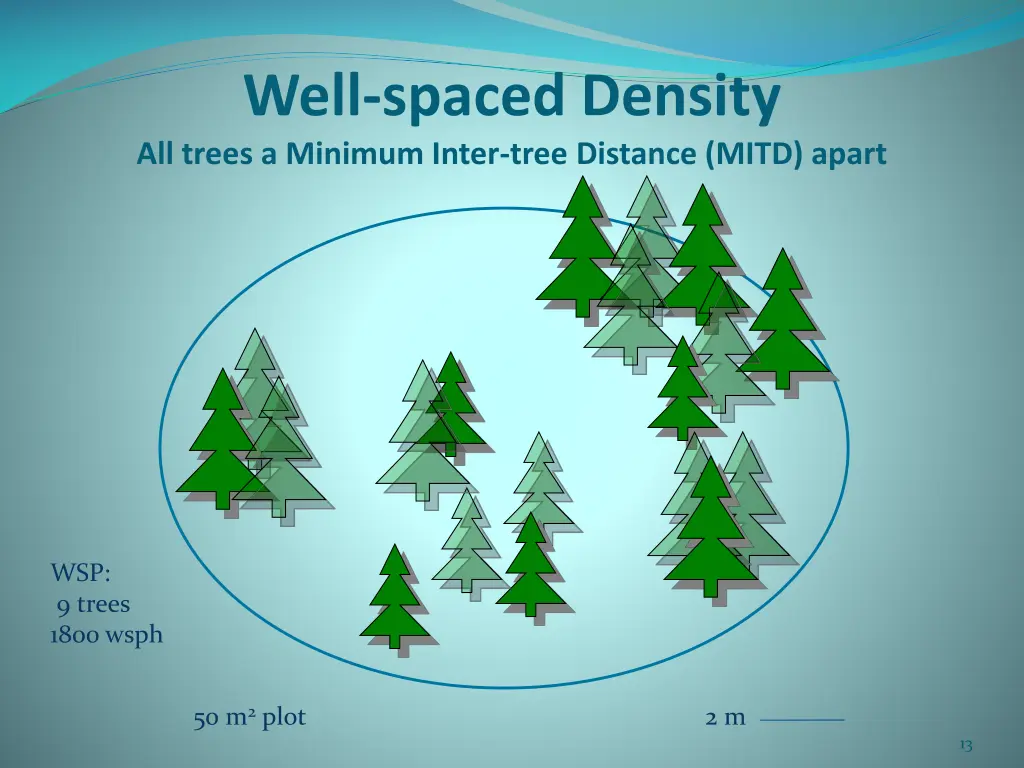
Well-spaced Density All trees a Minimum Inter-tree Distance (MITD) apart WSP: 9 trees 1800 wsph 50 m2plot 2 m 13
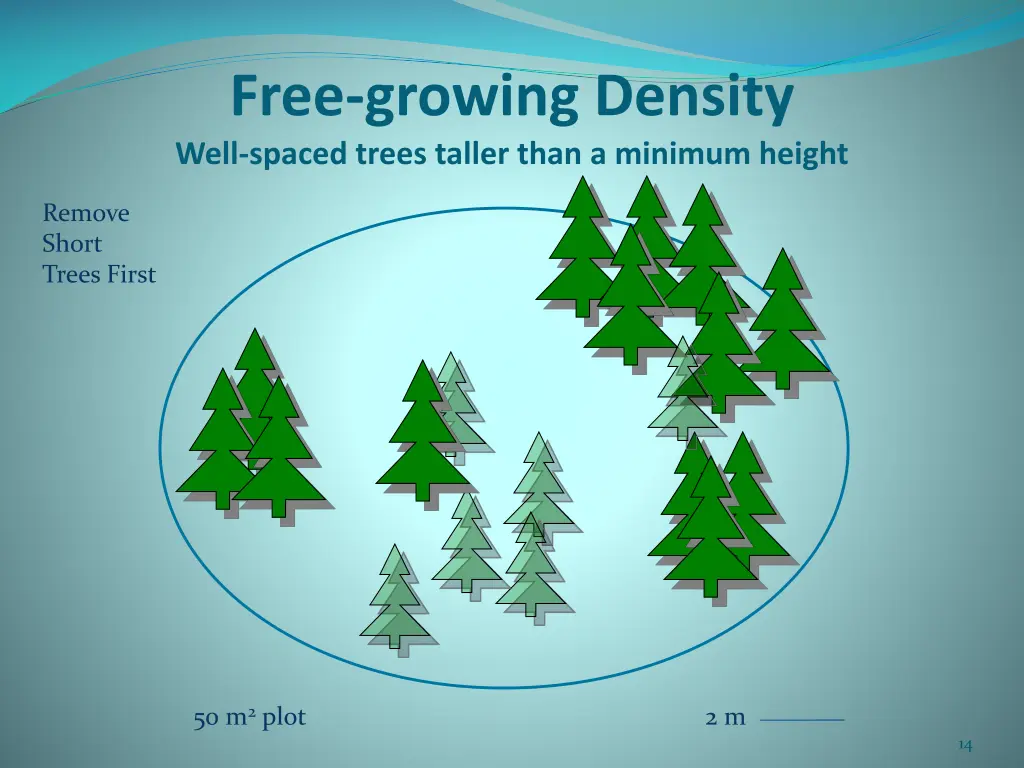
Free-growing Density Well-spaced trees taller than a minimum height Remove Short Trees First 50 m2plot 2 m 14
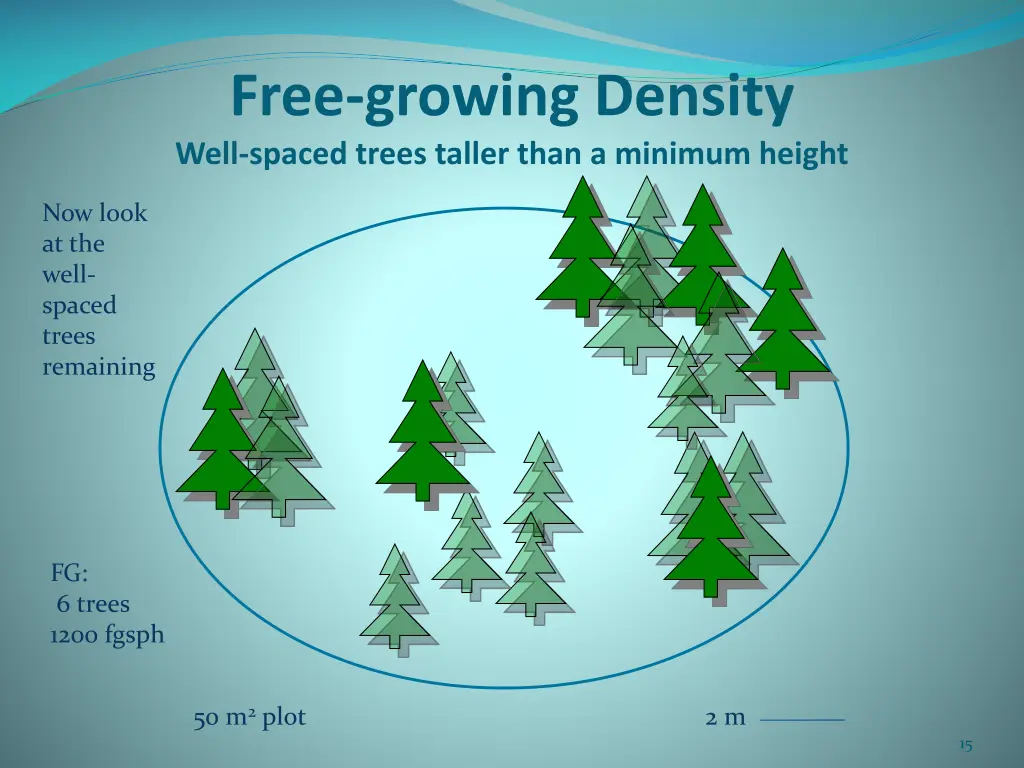
Free-growing Density Well-spaced trees taller than a minimum height Now look at the well- spaced trees remaining FG: 6 trees 1200 fgsph 50 m2plot 2 m 15
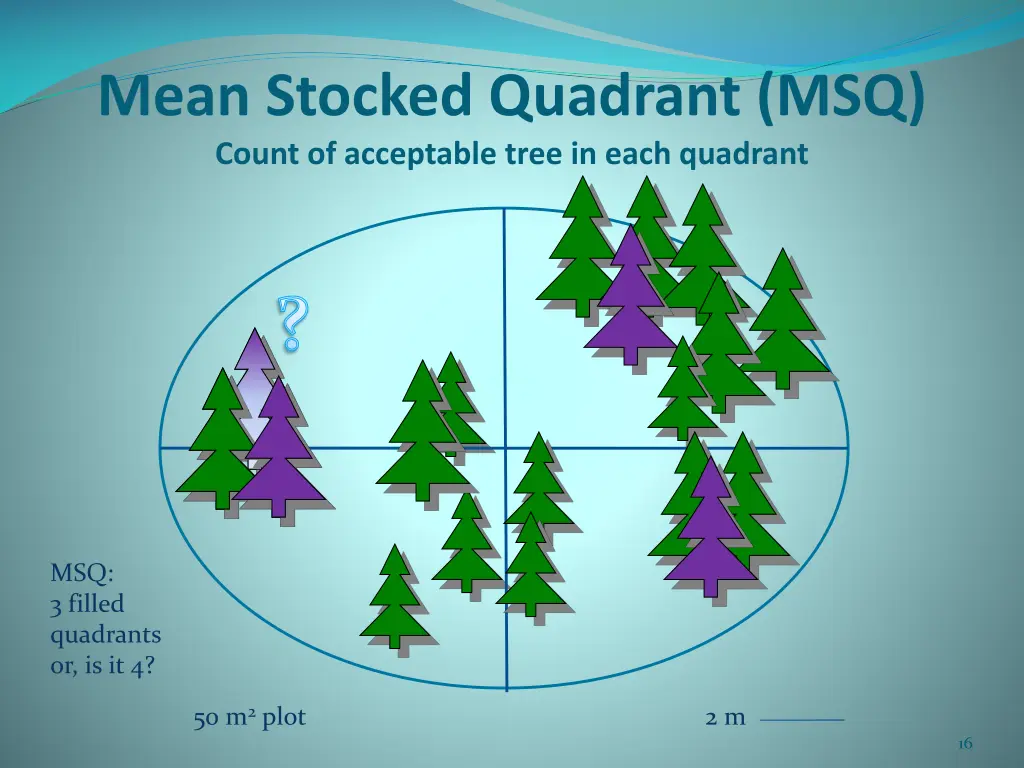
Mean Stocked Quadrant (MSQ) Count of acceptable tree in each quadrant MSQ: 3 filled quadrants or, is it 4? 50 m2plot 2 m 16
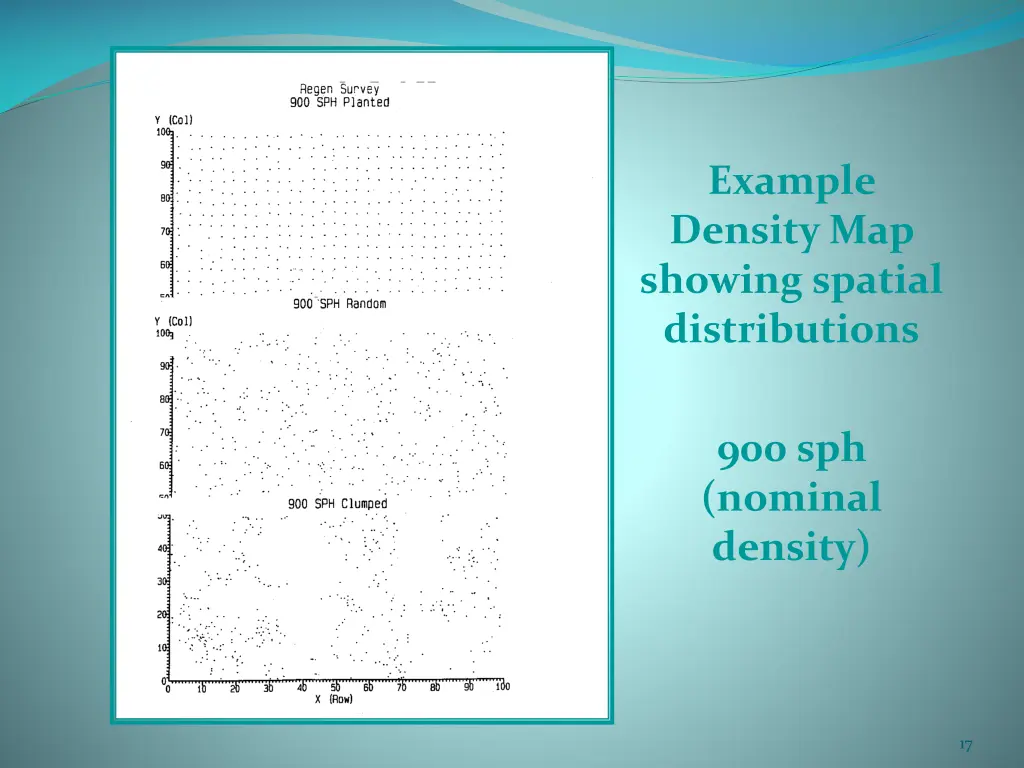
Example Density Map showing spatial distributions 900 sph (nominal density) 17
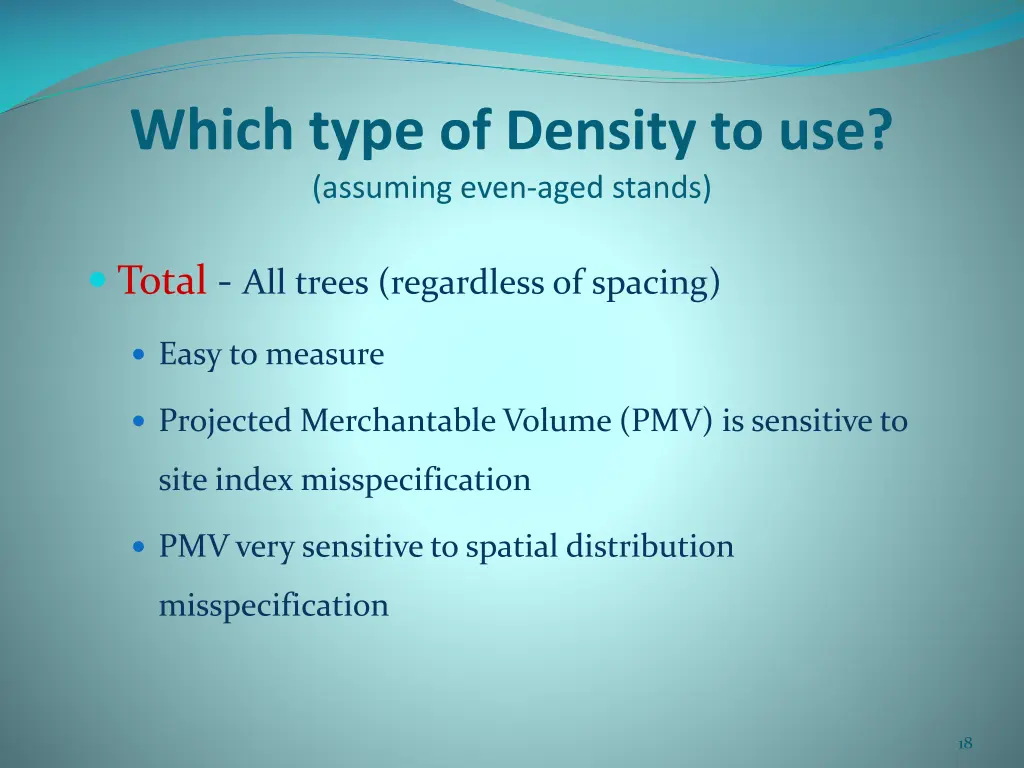
Which type of Density to use? (assuming even-aged stands) Total - All trees (regardless of spacing) Easy to measure Projected Merchantable Volume (PMV) is sensitive to site index misspecification PMV very sensitive to spatial distribution misspecification 18
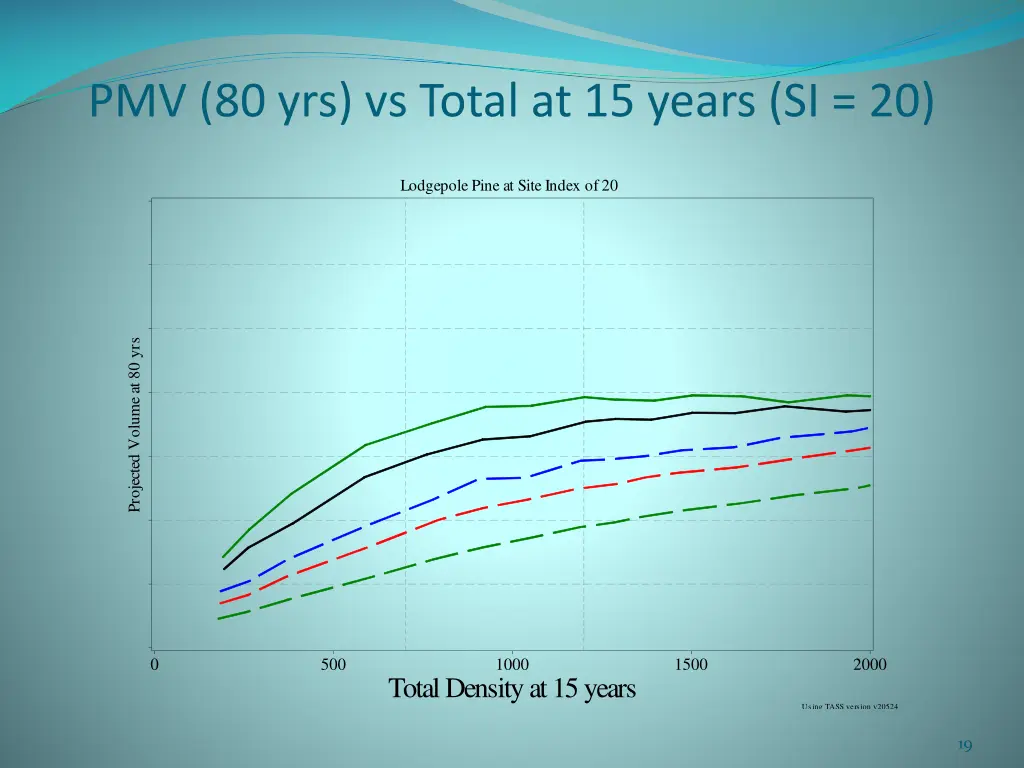
PMV (80 yrs) vs Total at 15 years (SI = 20) Lodgepole Pine at Site Index of 20 Projected Volume at 80 yrs 0 500 1000 1500 2000 Total Density at 15 years Using TASS version v20524 19
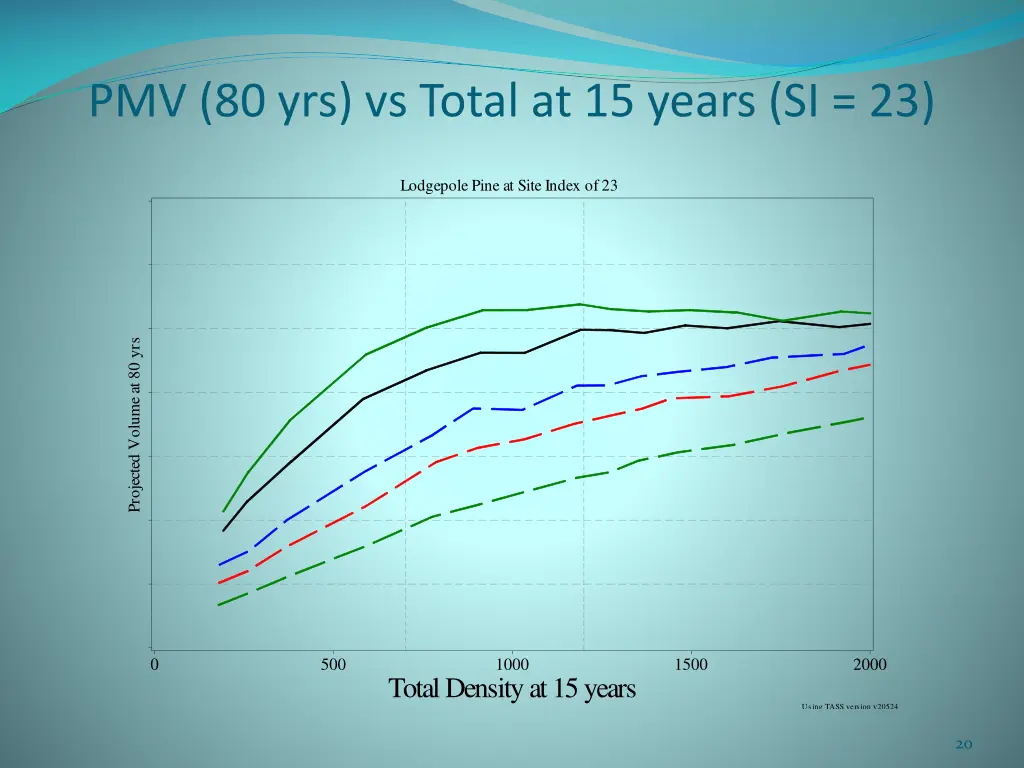
PMV (80 yrs) vs Total at 15 years (SI = 23) Lodgepole Pine at Site Index of 23 Projected Volume at 80 yrs 0 500 1000 1500 2000 Total Density at 15 years Using TASS version v20524 20
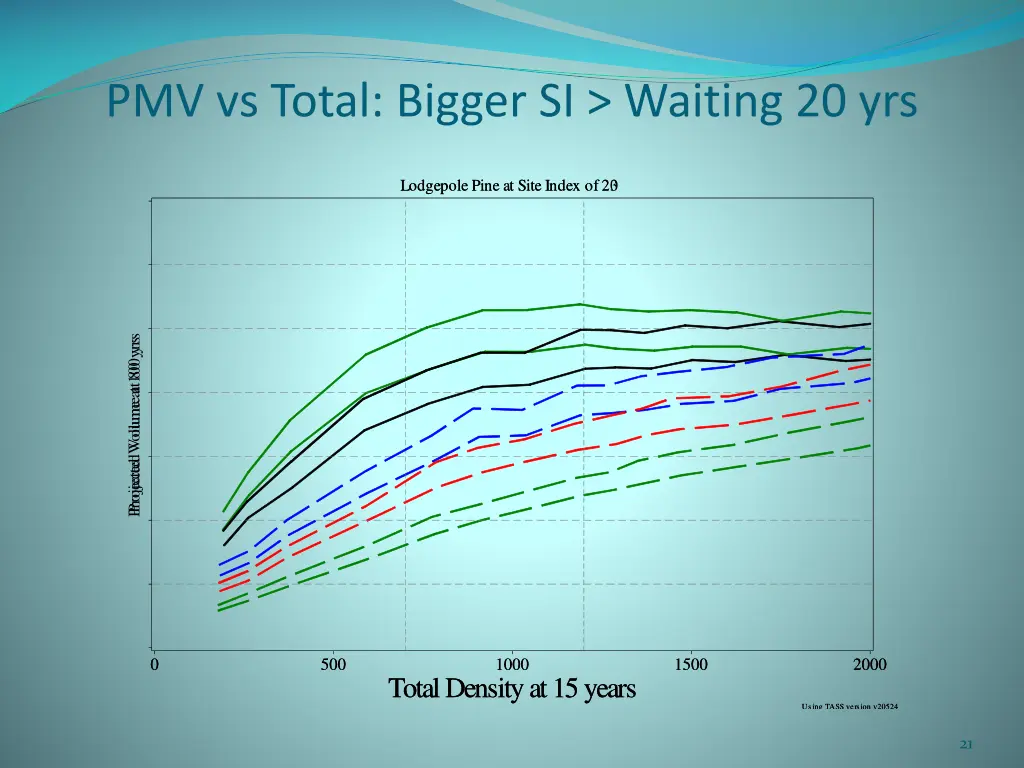
PMV vs Total: Bigger SI > Waiting 20 yrs Lodgepole Pine at Site Index of 20 Lodgepole Pine at Site Index of 23 Projected Volume at 100 yrs Projected Volume at 80 yrs 0 0 500 500 1000 1000 1500 1500 2000 2000 Total Density at 15 years Total Density at 15 years Using TASS version v20524 Using TASS version v20524 21
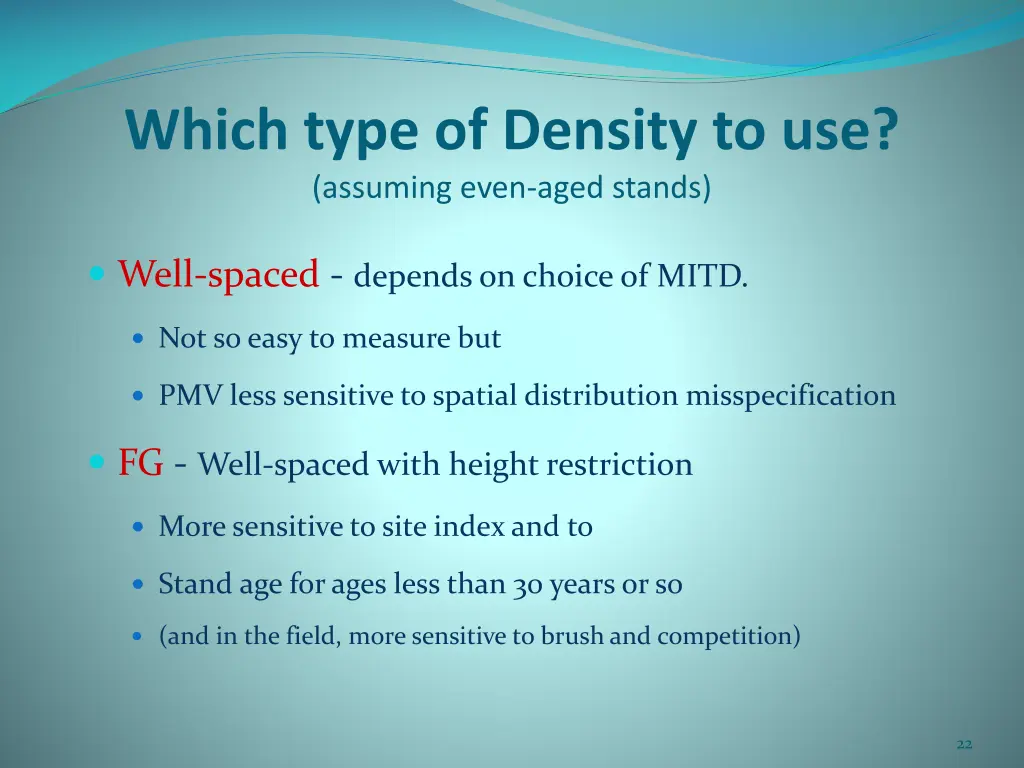
Which type of Density to use? (assuming even-aged stands) Well-spaced - depends on choice of MITD. Not so easy to measure but PMV less sensitive to spatial distribution misspecification FG - Well-spaced with height restriction More sensitive to site index and to Stand age for ages less than 30 years or so (and in the field, more sensitive to brush and competition) 22
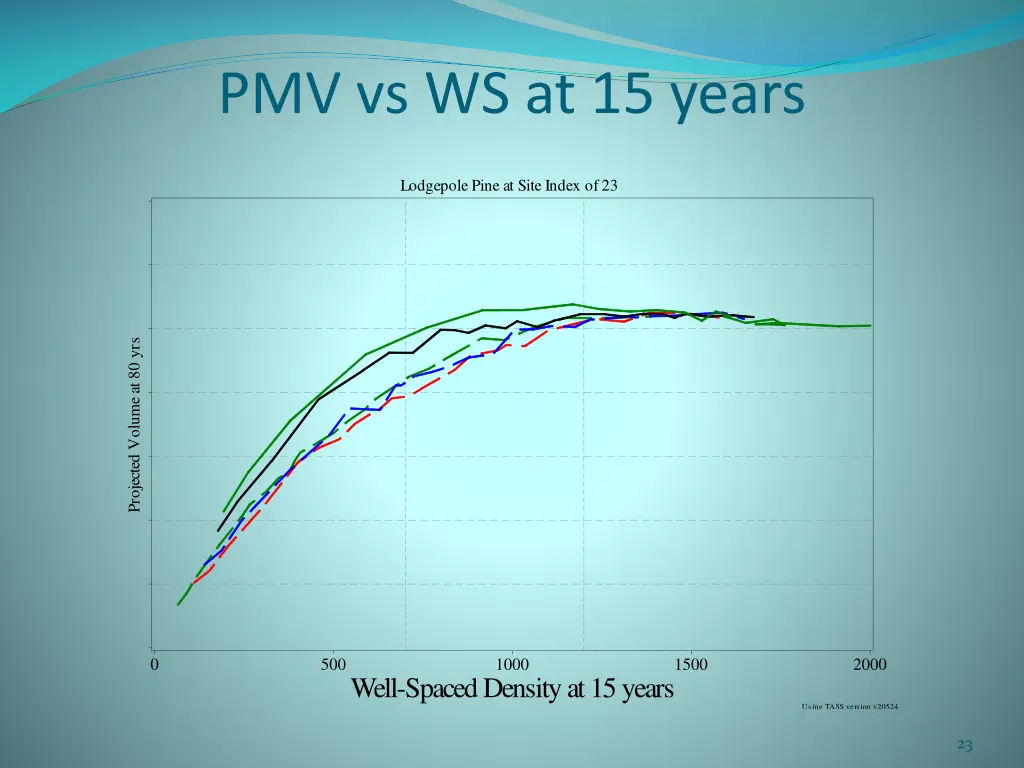
PMV vs WS at 15 years Lodgepole Pine at Site Index of 23 Projected Volume at 80 yrs 0 500 1000 1500 2000 Well-Spaced Density at 15 years Using TASS version v20524 23
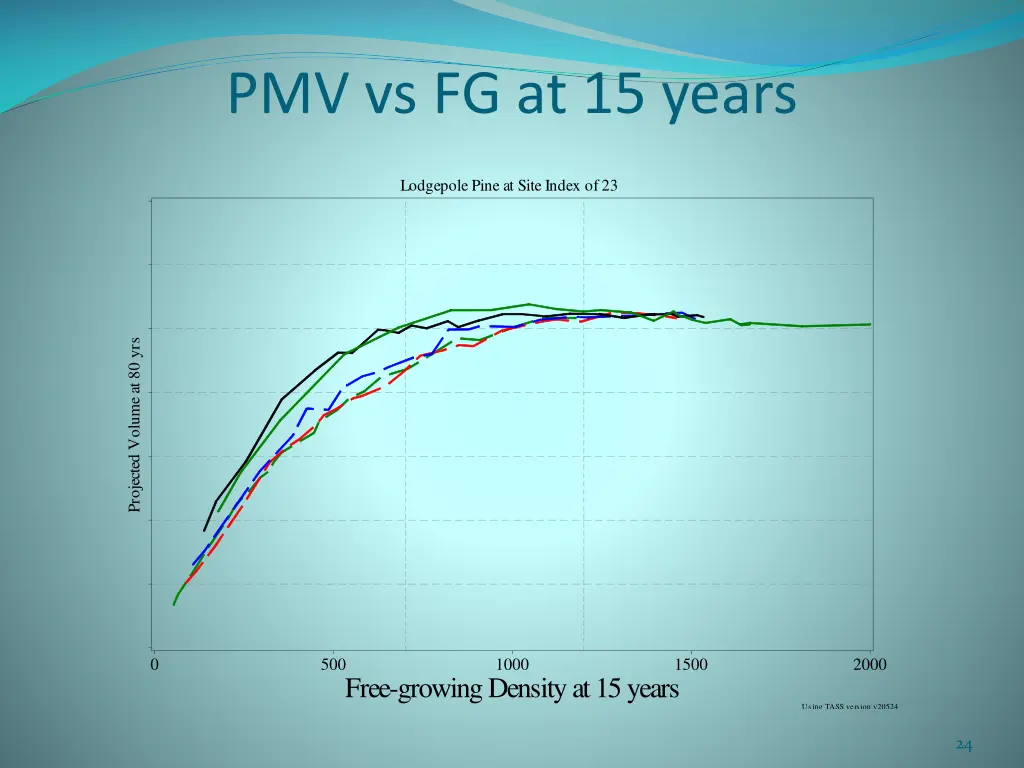
PMV vs FG at 15 years Lodgepole Pine at Site Index of 23 Projected Volume at 80 yrs 0 500 1000 1500 2000 Free-growing Density at 15 years Using TASS version v20524 24
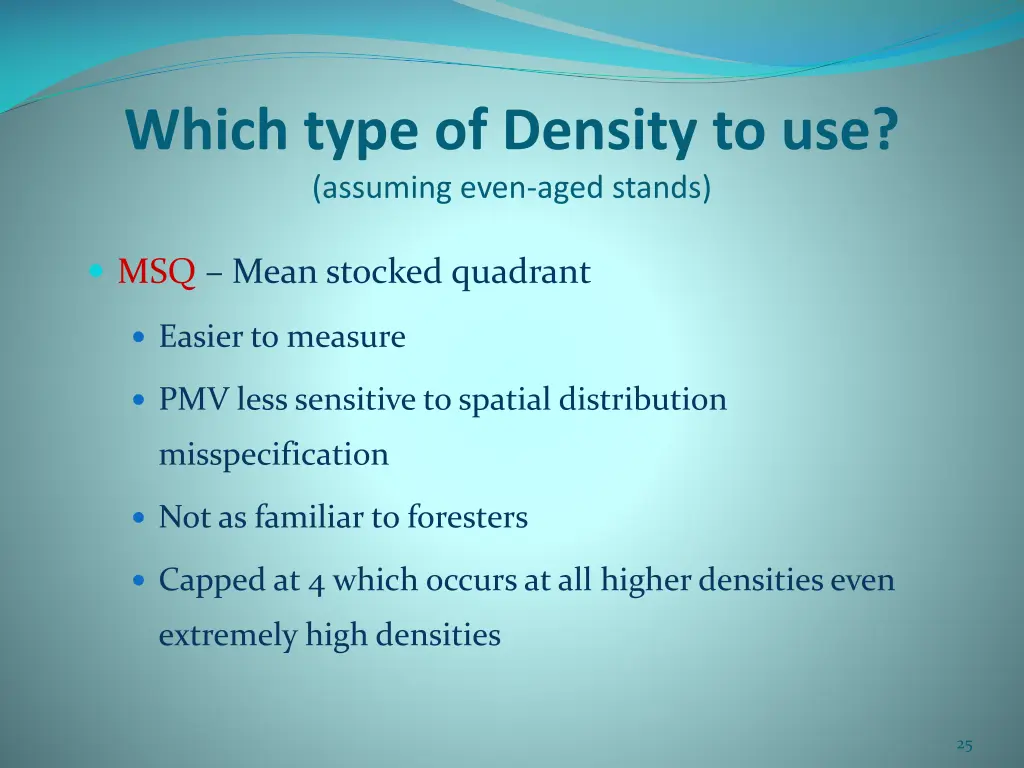
Which type of Density to use? (assuming even-aged stands) MSQ – Mean stocked quadrant Easier to measure PMV less sensitive to spatial distribution misspecification Not as familiar to foresters Capped at 4 which occurs at all higher densities even extremely high densities 25
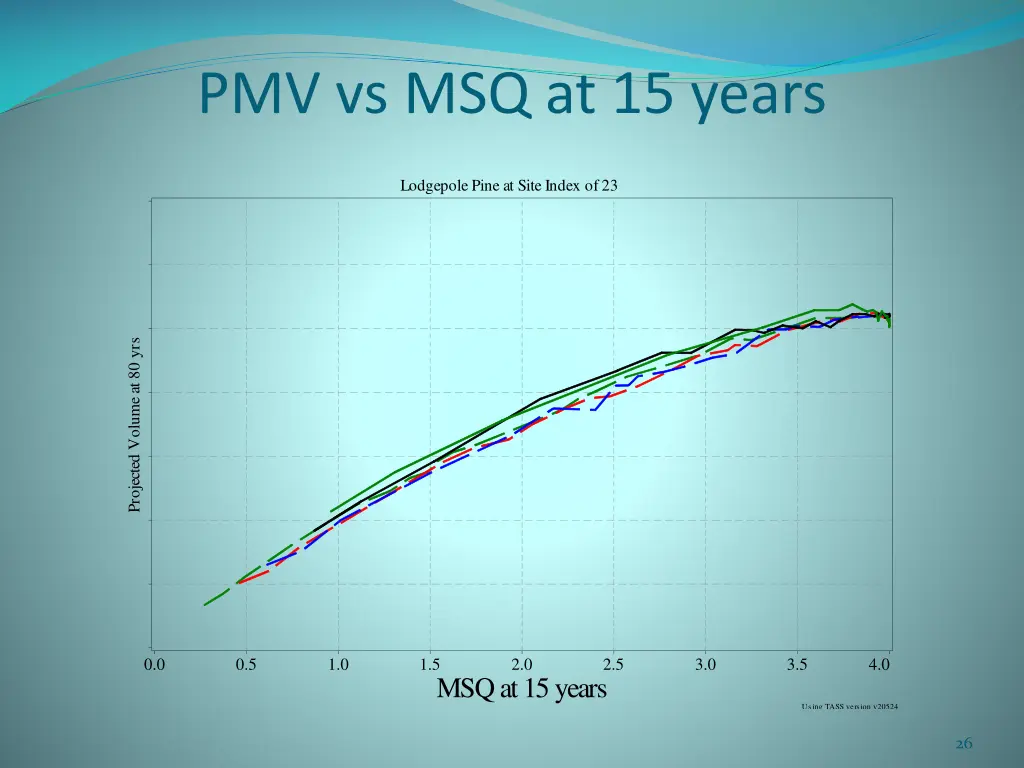
PMV vs MSQ at 15 years Lodgepole Pine at Site Index of 23 Projected Volume at 80 yrs 0.0 0.5 1.0 1.5 2.0 2.5 3.0 3.5 4.0 MSQ at 15 years Using TASS version v20524 26
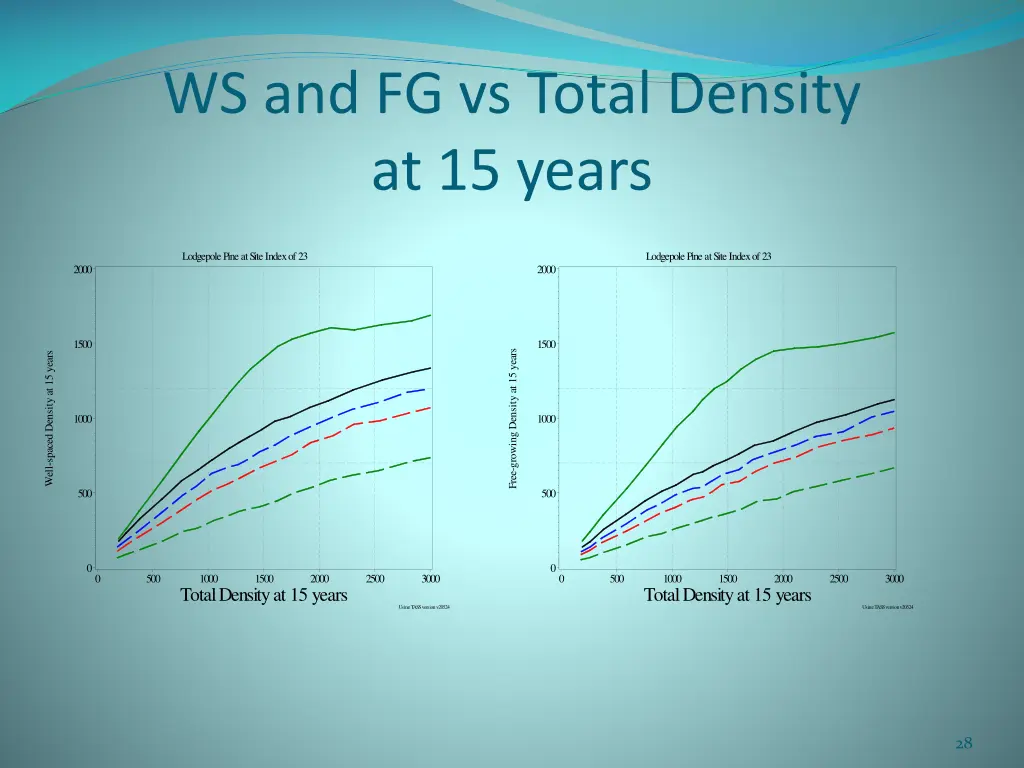
WS and FG vs Total Density at 15 years Lodgepole Pine at Site Index of 23 Lodgepole Pine at Site Index of 23 2000 2000 1500 1500 Free-growing Density at 15 years Well-spaced Density at 15 years 1000 1000 500 500 0 0 0 500 1000 1500 2000 2500 3000 0 500 1000 1500 2000 2500 3000 Total Density at 15 years Total Density at 15 years Using TASS version v20524 Using TASS version v20524 28
WS and FG vs Total Density effect of Site Index Lodgepole Pine at Site Index of 23 Lodgepole Pine at Site Index of 20 Lodgepole Pine at Site Index of 23 Lodgepole Pine at Site Index of 20 2000 2000 2000 2000 1500 1500 1500 1500 Free-growing Density at 15 years Free-growing Density at 15 years Well-spaced Density at 15 years Well-spaced Density at 15 years 1000 1000 1000 1000 500 500 500 500 0 0 0 0 0 0 500 500 1000 1000 1500 1500 2000 2000 2500 2500 3000 3000 0 0 500 500 1000 1000 1500 1500 2000 2000 2500 2500 3000 3000 Total Density at 15 years Total Density at 15 years Total Density at 15 years Total Density at 15 years Using TASS version v20524 Using TASS version v20524 Using TASS version v20524 Using TASS version v20524 29
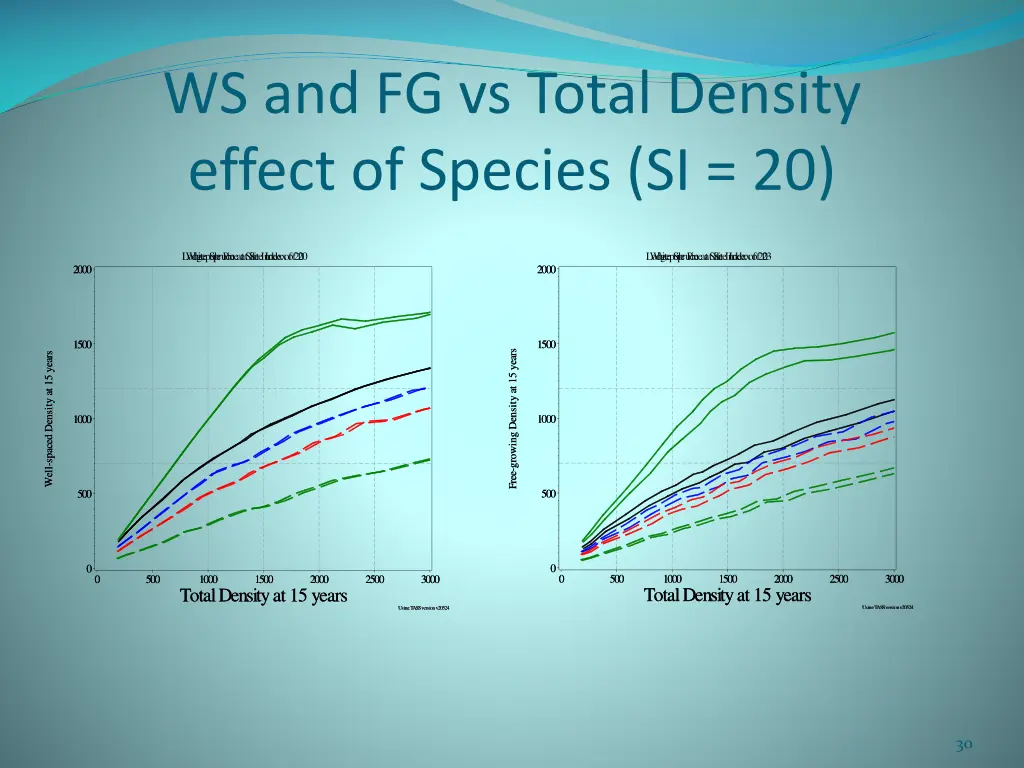
WS and FG vs Total Density effect of Species (SI = 20) W hite Spruce at Site Index of 20 Lodgepole Pine at Site Index of 23 W hite Spruce at Site Index of 20 Lodgepole Pine at Site Index of 20 2000 2000 2000 2000 1500 1500 1500 1500 Free-growing Density at 15 years Free-growing Density at 15 years Well-spaced Density at 15 years Well-spaced Density at 15 years 1000 1000 1000 1000 500 500 500 500 0 0 0 0 0 0 500 500 1000 1000 1500 1500 2000 2000 2500 2500 3000 3000 0 0 500 500 1000 1000 1500 1500 2000 2000 2500 2500 3000 3000 Total Density at 15 years Total Density at 15 years Total Density at 15 years Total Density at 15 years Using TASS version v20524 Using TASS version v20524 Using TASS version v20524 Using TASS version v20524 30
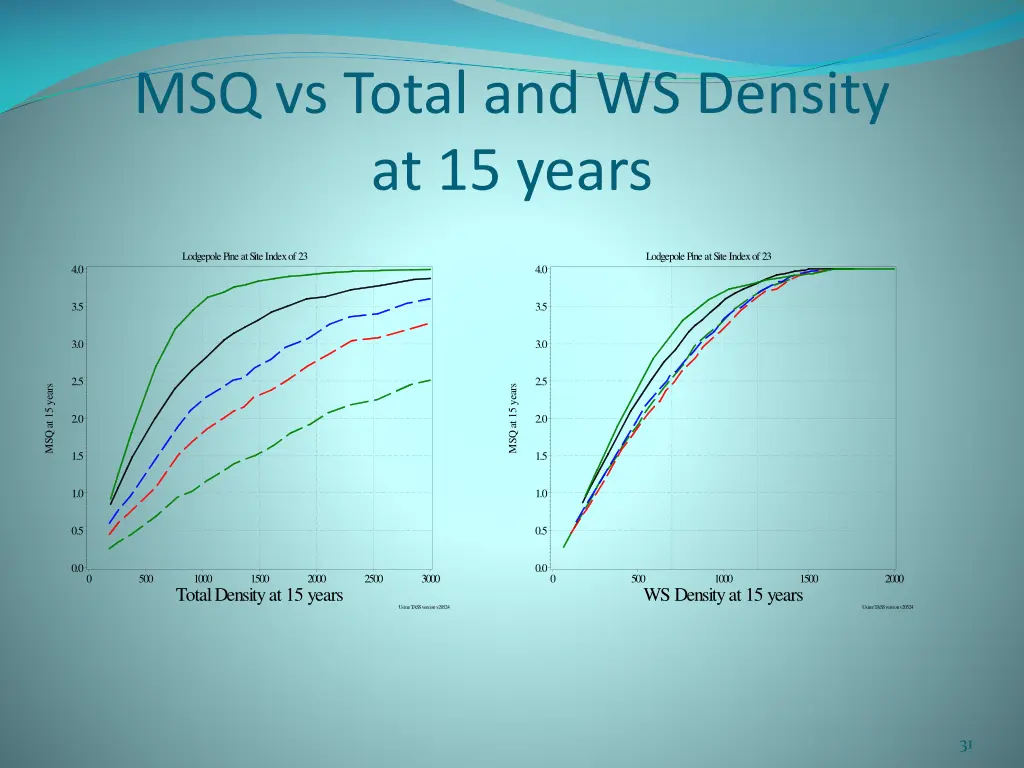
MSQ vs Total and WS Density at 15 years Lodgepole Pine at Site Index of 23 Lodgepole Pine at Site Index of 23 4.0 4.0 3.5 3.5 3.0 3.0 2.5 2.5 MSQ at 15 years MSQ at 15 years 2.0 2.0 1.5 1.5 1.0 1.0 0.5 0.5 0.0 0.0 0 500 1000 1500 2000 2500 3000 0 500 1000 1500 2000 Total Density at 15 years WS Density at 15 years Using TASS version v20524 Using TASS version v20524 31
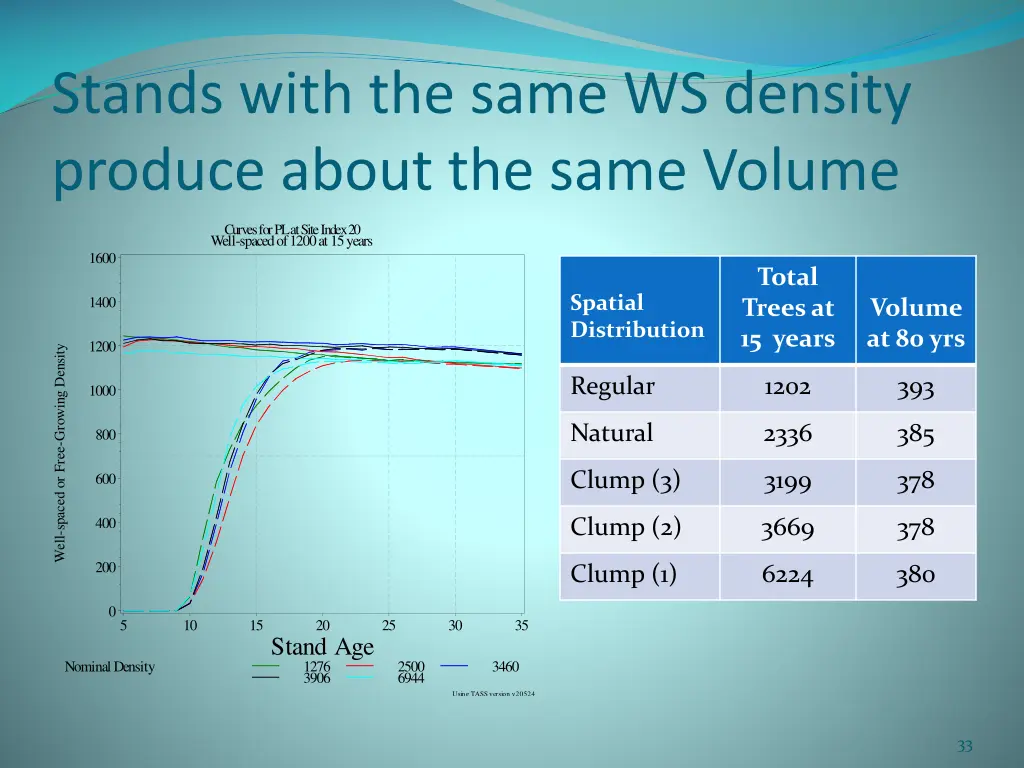
Stands with the same WS density produce about the same Volume Curves for PL at Site Index 20 Well-spaced of 1200 at 15 years 1600 Total Trees at 15 years Spatial Distribution 1400 Volume at 80 yrs 1200 Well-spaced or Free-Growing Density Regular 1202 393 1000 Natural 2336 385 800 Clump (3) 3199 378 600 400 Clump (2) 3669 378 200 Clump (1) 6224 380 0 5 10 15 20 25 30 35 Stand Age Nominal Density 1276 3906 2500 6944 3460 Using TASS version v20524 33
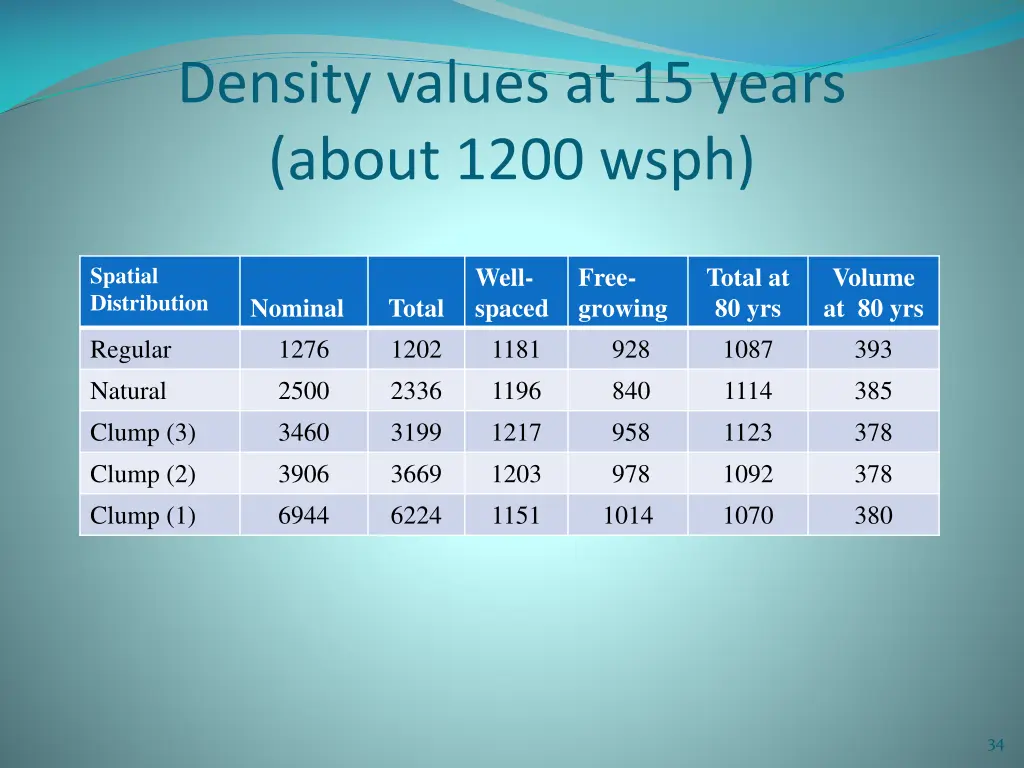
Density values at 15 years (about 1200 wsph) Well- spaced 1181 1196 1217 1203 1151 Free- growing 928 840 958 978 1014 Total at 80 yrs 1087 1114 1123 1092 1070 Volume at 80 yrs 393 385 378 378 380 Spatial Distribution Nominal 1276 2500 3460 3906 6944 Total 1202 2336 3199 3669 6224 Regular Natural Clump (3) Clump (2) Clump (1) 34
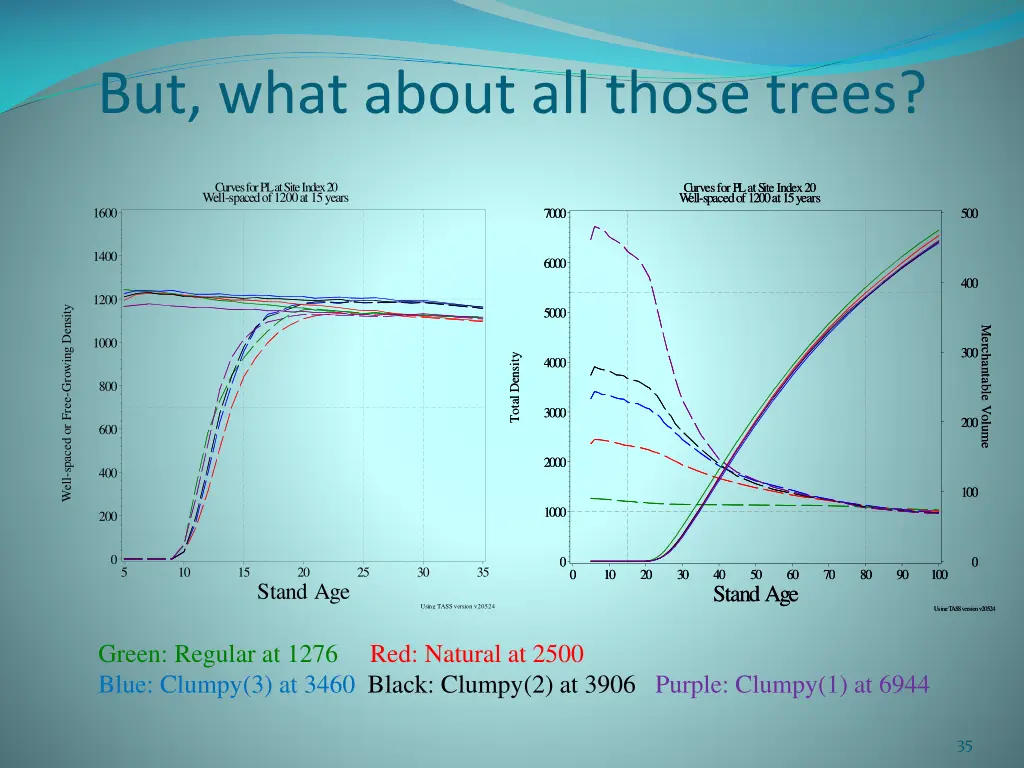
But, what about all those trees? Curves for PL at Site Index 20 Well-spaced of 1200 at 15 years Curves for PL at Site Index 20 W ell-spaced of 1200 at 15 years W ell-spaced of 1200 at 15 years Curves for PL at Site Index 20 1600 7000 7000 500 500 1400 6000 6000 400 400 1200 Well-spaced or Free-Growing Density 5000 5000 Merchantable Volume Merchantable Volume 1000 300 300 Total Density Total Density 4000 4000 800 3000 3000 200 200 600 2000 2000 400 100 100 1000 1000 200 0 0 0 0 0 5 10 15 20 25 30 35 0 0 10 10 20 20 30 30 40 40 50 50 60 60 70 70 80 80 90 90 100 100 Stand Age Stand Age Stand Age Using TASS version v20524 Using TASS version v20524 Using TASS version v20524 Green: Regular at 1276 Red: Natural at 2500 Blue: Clumpy(3) at 3460 Black: Clumpy(2) at 3906 Purple: Clumpy(1) at 6944 35
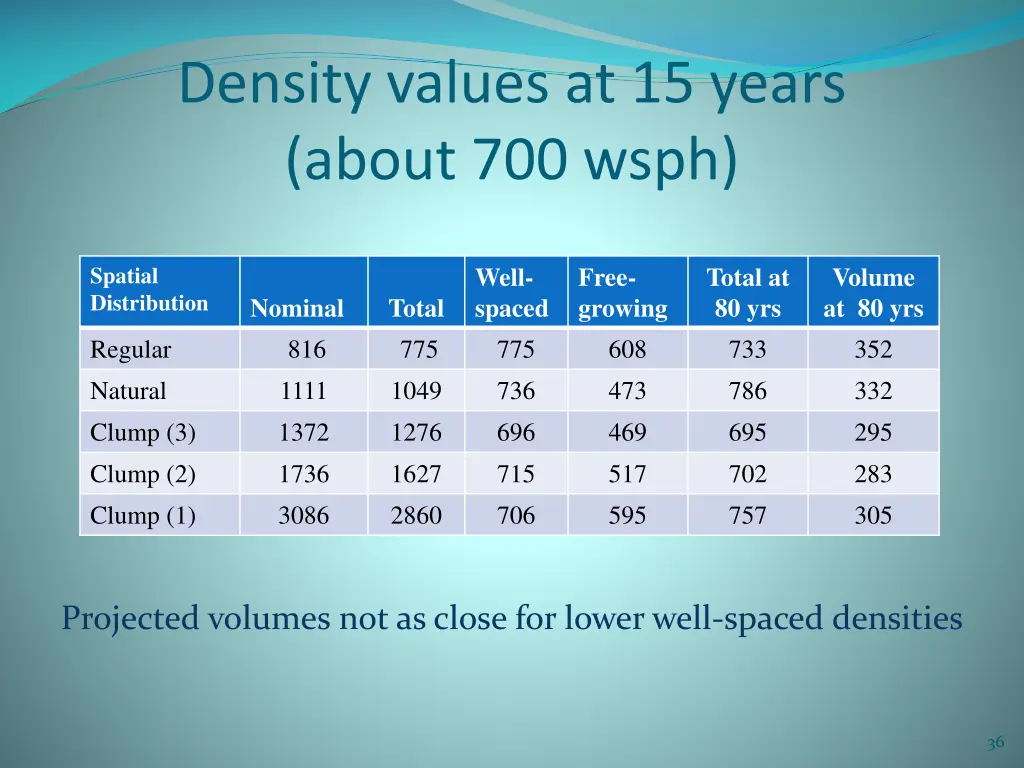
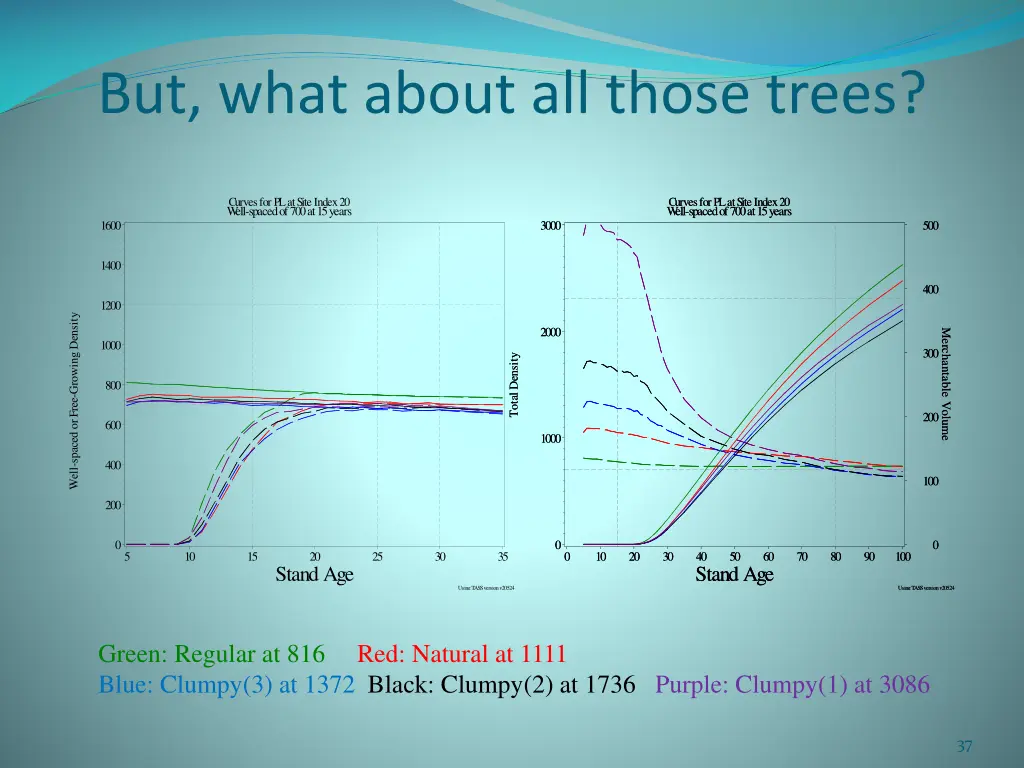
Density values at 15 years (about 700 wsph) Well- spaced 775 736 696 715 706 Free- growing 608 473 469 517 595 Total at 80 yrs 733 786 695 702 757 Volume at 80 yrs 352 332 295 283 305 Spatial Distribution Nominal 816 1111 1372 1736 3086 Total 775 1049 1276 1627 2860 Regular Natural Clump (3) Clump (2) Clump (1) Projected volumes not as close for lower well-spaced densities 36
But, what about all those trees? Curves for PL at Site Index 20 W ell-spaced of 700 at 15 years Curves for PL at Site Index 20 W ell-spaced of 700 at 15 years W ell-spaced of 700 at 15 years Curves for PL at Site Index 20 1600 3000 3000 500 500 1400 400 400 1200 Well-spaced or Free-Growing Density 2000 2000 Merchantable Volume Merchantable Volume 1000 300 300 Total Density Total Density 800 200 200 600 1000 1000 400 100 100 200 0 0 0 0 0 5 10 15 20 25 30 35 0 0 10 10 20 20 30 30 40 40 50 50 60 60 70 70 80 80 90 90 100 100 Stand Age Stand Age Stand Age Using TASS version v20524 Using TASS version v20524 Using TASS version v20524 Green: Regular at 816 Red: Natural at 1111 Blue: Clumpy(3) at 1372 Black: Clumpy(2) at 1736 Purple: Clumpy(1) at 3086 37
What spatial distribution to use? How can we tell from field data which spatial distribution best matches the stand? There are several indices in the literature, e.g. Pielou’s index of dispersion or Morisita’s index. We could also consider the ratio of the total trees to the well-spaced trees, both readily available from survey data. Preliminary work shows that this ratio is a simple function of the total trees. I’ve been thinking about this for years, but haven’t been able to pull anything together yet. 38
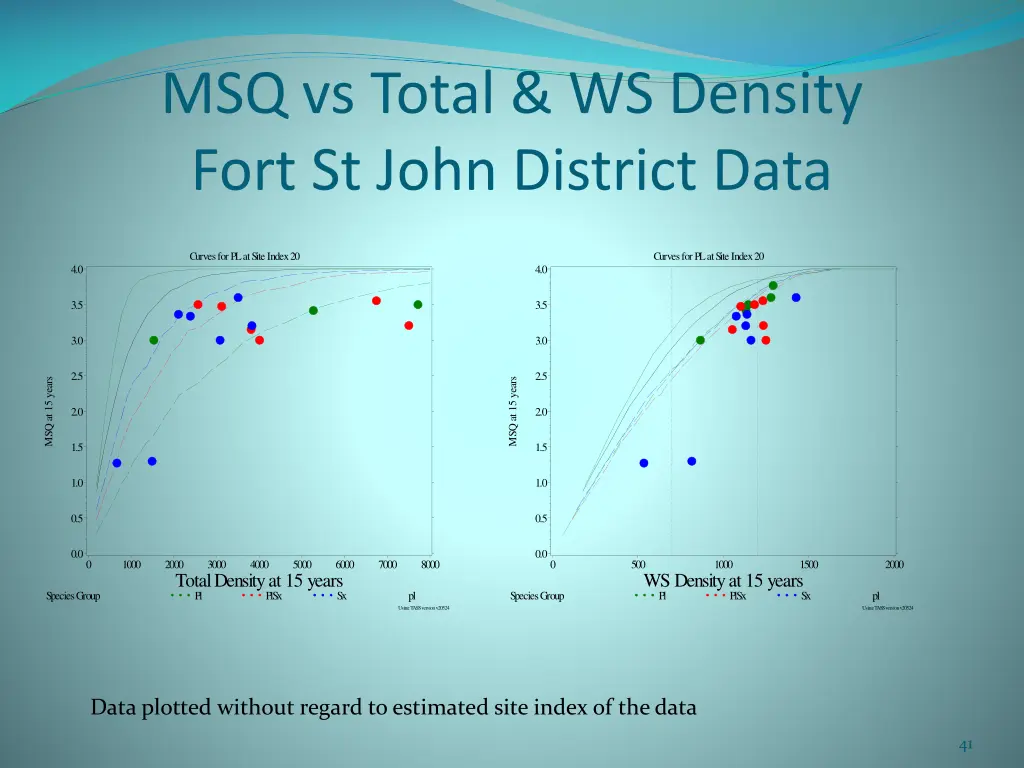
Fort St John District Data District collected 895 standard silviculture survey plots in many but not all of the Multi-block strata of the Fort St John Pilot Project (15 year old cutblocks) Also collected MSQ data – plots divided into quadrants and presence of an acceptable tree determined for each quadrant – values 0 to 4. Plots placed into 18 strata, regardless of cutblocks Three species groups: Pl, Pl/Sx, Sx Wide range of site index observed 39
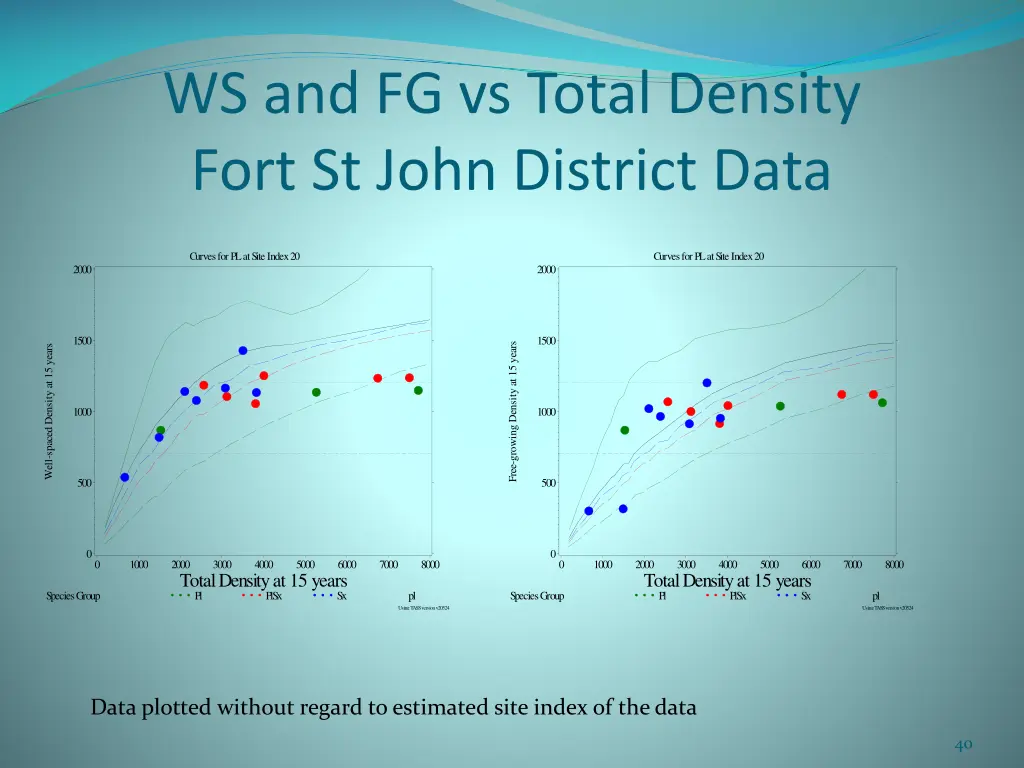
WS and FG vs Total Density Fort St John District Data Curves for PL at Site Index 20 Curves for PL at Site Index 20 2000 2000 1500 1500 Free-growing Density at 15 years Well-spaced Density at 15 years 1000 1000 500 500 0 0 0 1000 2000 3000 4000 5000 6000 7000 8000 0 1000 2000 3000 4000 5000 6000 7000 8000 Total Density at 15 years Total Density at 15 years Species Group Pl PlSx Sx pl Species Group Pl PlSx Sx pl Using TASS version v20524 Using TASS version v20524 Data plotted without regard to estimated site index of the data 40
MSQ vs Total & WS Density Fort St John District Data Curves for PL at Site Index 20 Curves for PL at Site Index 20 4.0 4.0 3.5 3.5 3.0 3.0 2.5 2.5 MSQ at 15 years MSQ at 15 years 2.0 2.0 1.5 1.5 1.0 1.0 0.5 0.5 0.0 0.0 0 1000 2000 3000 4000 5000 6000 7000 8000 0 500 1000 1500 2000 Total Density at 15 years WS Density at 15 years Species Group Pl PlSx Sx pl Species Group Pl PlSx Sx pl Using TASS version v20524 Using TASS version v20524 Data plotted without regard to estimated site index of the data 41
Post-free growing Survey Study FREP project with Alex Woods in Smithers Sixty stands in two areas declared free-growing between 1987 and 2001 were randomly selected using RESULTS Stands re-surveyed in 2005 (Lakes) and 2006 (Okanagan) using standard silviculture survey methodology and current forest health standards. FREP is now piloting a Stand Development Monitoring (SDM) program based on this work. 42
Purpose of Free-Growing Policy: •“free-growing requirements ensure that reforested stands remain successfully reforested.” Forest Practices Board Special Report No. 16 (2003), •The licensee obligation to create free-growing stands is one of the few measurable results under the Forest and Range Practices Act. 43
Features of the Silviculture Survey • Uses 50 m2plots (3.99 m radius -- 1/200thha) • Usually 1 plot per hectare placed in survey area • Count number of acceptable, well-spaced trees • Trees must be a minimum tree height to be counted in Free-growing surveys • Well-spaced is defined by the Minimum Inter-tree Distance (MITD) • Count is capped by the M-value (this is the equivalent plot count for the Target Stocking Standard, TSS, i.e., M = TSS/200) 44
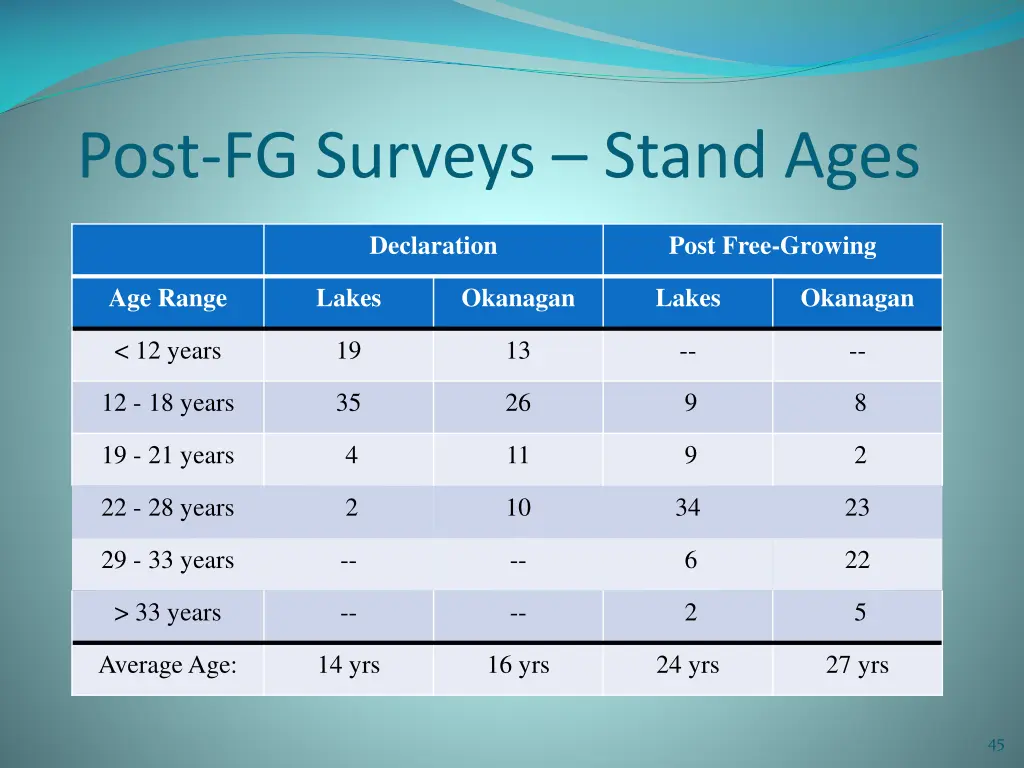
Post-FG Surveys – Stand Ages Declaration Post Free-Growing Age Range Lakes Okanagan Lakes Okanagan < 12 years 19 13 -- -- 12 - 18 years 35 26 9 8 19 - 21 years 4 11 9 2 22 - 28 years 2 10 34 23 29 - 33 years -- -- 6 22 > 33 years -- -- 2 5 Average Age: 14 yrs 16 yrs 24 yrs 27 yrs 45
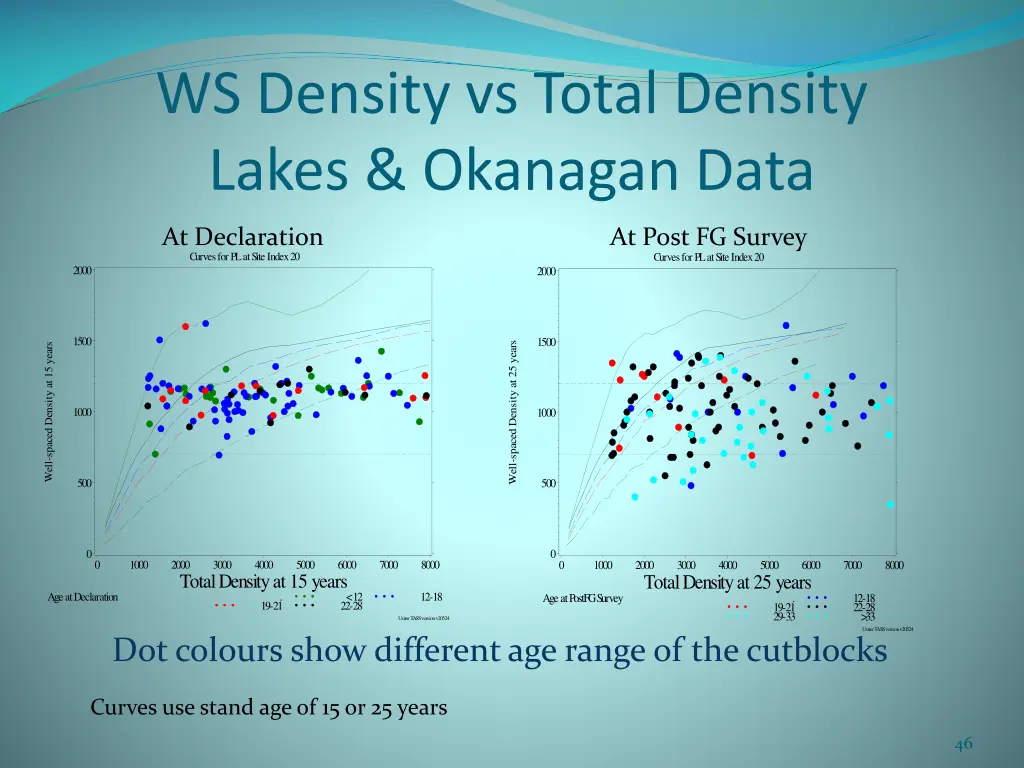
WS Density vs Total Density Lakes & Okanagan Data Curves for PL at Site Index 20 At Declaration Curves for PL at Site Index 20 At Post FG Survey 2000 2000 1500 1500 Well-spaced Density at 25 years Well-spaced Density at 15 years 1000 1000 500 500 0 0 0 1000 2000 3000 4000 5000 6000 7000 8000 0 1000 2000 3000 4000 5000 6000 7000 8000 Total Density at 15 years Total Density at 25 years Age at Declaration . < 12 22-28 12-18 Age at PostFG Survey . 12-18 22-28 >33 19-21 19-21 29-33 Using TASS version v20524 Using TASS version v20524 Dot colours show different age range of the cutblocks Curves use stand age of 15 or 25 years 46
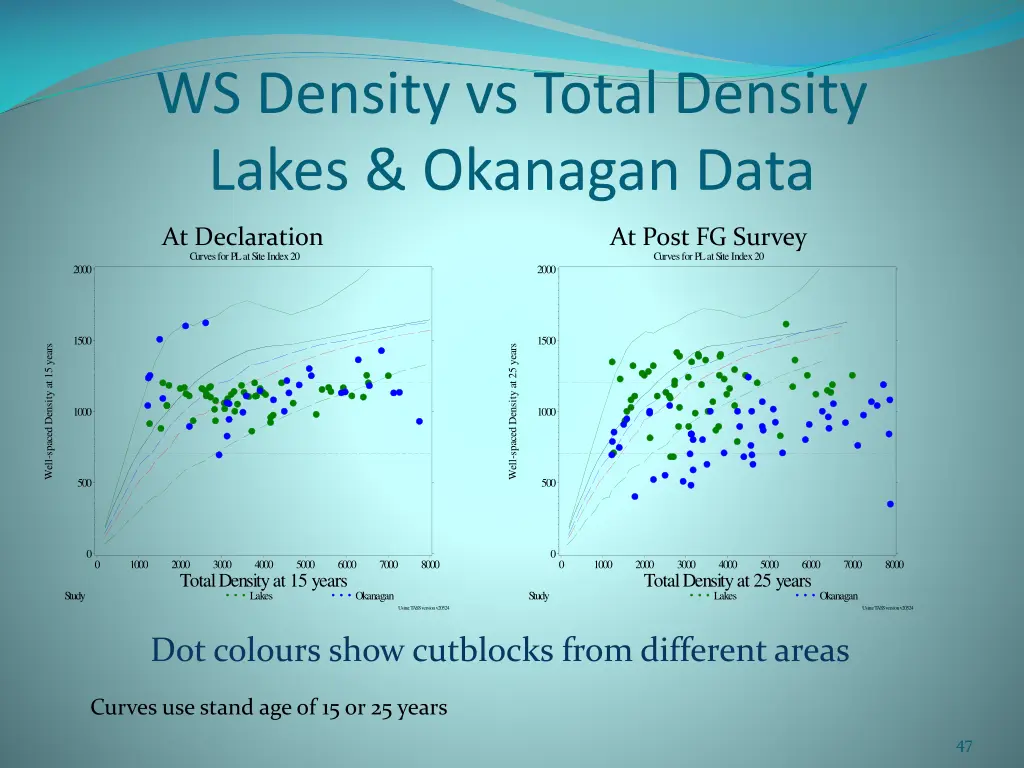
WS Density vs Total Density Lakes & Okanagan Data Curves for PL at Site Index 20 At Declaration Curves for PL at Site Index 20 At Post FG Survey 2000 2000 1500 1500 Well-spaced Density at 15 years Well-spaced Density at 25 years 1000 1000 500 500 0 0 0 1000 2000 3000 4000 5000 6000 7000 8000 0 1000 2000 3000 4000 5000 6000 7000 8000 Total Density at 15 years Total Density at 25 years Study Lakes Okanagan Study Lakes Okanagan Using TASS version v20524 Using TASS version v20524 Dot colours show cutblocks from different areas Curves use stand age of 15 or 25 years 47
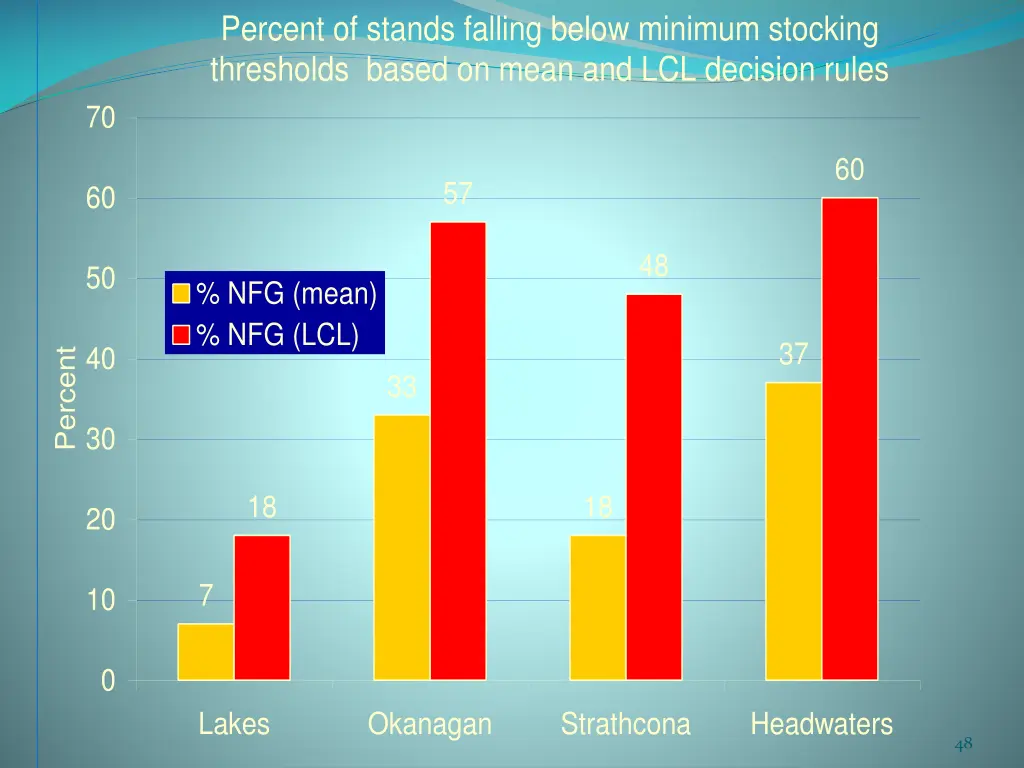
Percent of stands falling below minimum stocking thresholds based on mean and LCL decision rules 70 60 57 60 48 50 % NFG (mean) % NFG (LCL) 37 40 Percent 33 30 18 18 20 7 10 0 Lakes Okanagan Strathcona Headwaters 48
Post FG Question: Should stands at 25 years of age (or older) have about the same well-spaced and free-growing densities as at declaration? Or should these values have decreased, and if so, by how much? Used TASS and TIPSY with the new output density variables to assess this. 49
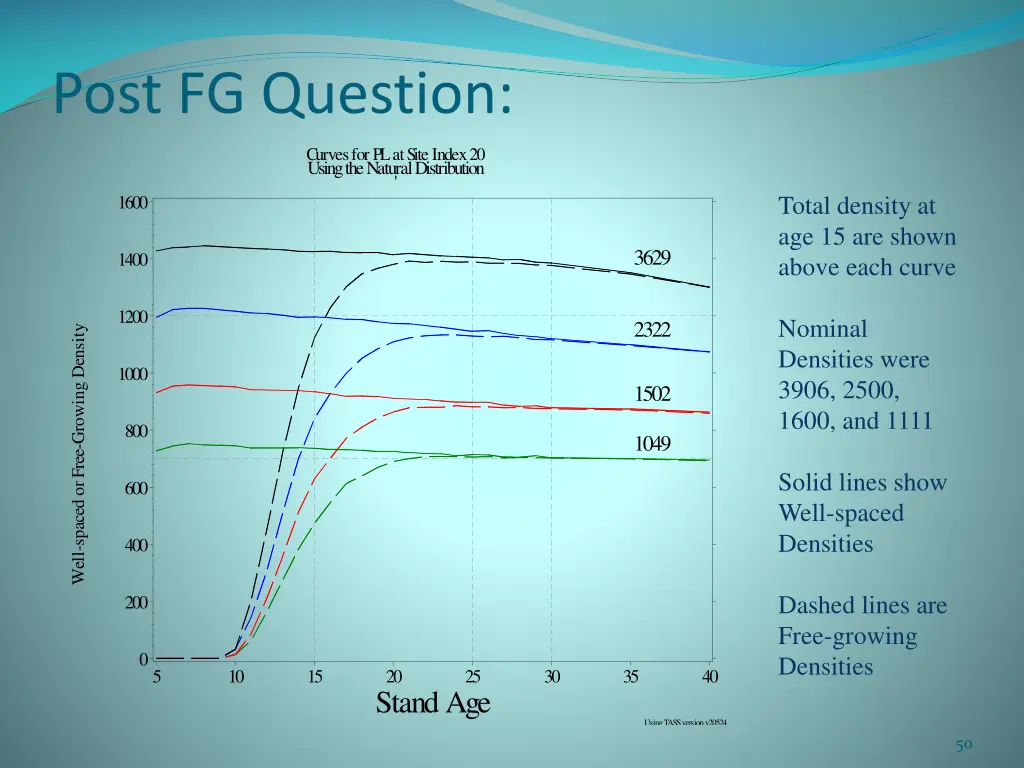
Post FG Question: Curves for PL at Site Index 20 Using the Natural Distribution ' Total density at age 15 are shown above each curve 1600 3629 1400 1200 Nominal Densities were 3906, 2500, 1600, and 1111 2322 Well-spaced or Free-Growing Density 1000 1502 800 1049 Solid lines show Well-spaced Densities 600 400 Dashed lines are Free-growing Densities 200 0 5 10 15 20 25 30 35 40 Stand Age Using TASS version v20524 50


![[Epub] Two Meals a Day: The Simple, Sustainable Strategy to Lose Fat, Reverse Aging, and Break Free from Diet Frustratio](https://cdn5.slideserve.com/11100879/slide1-dt.jpg)
![Download [ebook] 2030: How Today's Biggest Trends Will Collide and Reshape the Future of Everything of Everything Full](https://cdn5.slideserve.com/11103519/slide1-dt.jpg)