Download
1 / 34
350 likes | 526 Views
This framework explores the vital connection between poverty measurement and nutrition security, emphasizing the immediate and underlying causes of poverty and their impact on dietary intake, health status, and labor productivity. It highlights the importance of policies that promote food production, improve health services, and enhance caregivers' capacities. By analyzing poverty dimensions—income, education, health, and multiple deprivations—this framework aims to inform policymakers and stakeholders about effective strategies for alleviating poverty and improving nutrition security.

E N D
Poverty Measurement and Analysis Suresh Babu International Food Policy Research Institute
Conceptual Framework of Linking Poverty & Nutrition Nutrition Security Adult development and Labor productivity Dietary Intake Macro-nutrients Micro-nutrients Immediate Causes Health Status Access to food Household income/ expenditures on food Health environment & services Access & quality of health, sanitation & water Maternal & child care practices Quality & quantity of care • Policies that encourage • -food production • income generation • transfer food in-kind Policies that improve -adequate sanitation -safe water supply -health care availability -environmental safety/ shelter Policies & programs that increase -caregivers access -caregivers resource control -caregivers knowledge, adoption & practice Underlying Causes Political & legal Institutions Political commitment, legal structures for implementing food laws Basic Causes Resource control, ownership, use Resource use & pricing policies Potential resources Poverty/natural resources availability/ agricultural technology
Immediate Causes Adult development Nutrition Security Labor productivity Dietary Intake Macro-nutrients Micro-nutrients Health Status Health environment & services Access & quality of health, sanitation & water Access to food Household income/ expenditures on food Maternal & child care practices Quality & quantity of care
Underlying Causes • Policies that encourage • -food production • income generation • transfer food in-kind policies that improve -adequate sanitation -safe water supply -health care availability -environmental safety/ shelter Policies & programs that increase -caregivers access -caregivers resource control -caregivers knowledge, adoption & practice
Basic Causes Political & legal institutions Political commitment, legal structures for implementing food laws Resource control, ownership, use Resource use & pricing policies Potential resources Poverty/natural resources availability/ agricultural technology Sources: Adapted from UNICEF (1998); Haddad (1999); and Smith and Haddad (2000)
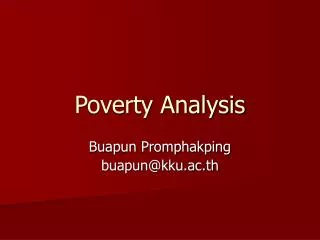
Introduction to Poverty Analysis • Why poverty analysis? • Who wants poverty information? • Role of policymakers & policy analysts • Poverty estimates for policy analysis • Poverty estimates for policy evaluation • Cost-effectiveness of poverty analysis
What is Poverty? • Poverty is “welfare level below a reasonable minimum.” • Poverty has various dimensions • Income poverty • Security poverty • Education poverty • Health – Nutrition Poverty • Multiple deprivation • Poor people’s perception of poverty level
What do we mean by “Poverty”? The primary focus is on individuals or groups suffering from multiple deprivations Education poor Core Poor Health Poor Security Poor Income Poor
Poverty Lines and Poverty Measurement • Two Issues in Generating Poverty Estimates • Fixing a poverty line: Identification • Measuring poverty: Aggregation
Methods of Fixing Poverty Lines • Cost-of-basic-needs method (Food-share method) • Cost of basic food needs • Cost of basic non-food needs • Food-energy method • Expenditure level that meets the food energy requirement • Based on calorie-income relationships • Fitting and tracing calorie-expenditure graph
Cost-of-Basic-Needs Method Total Poverty Line = Z Z=ZF + ZN ZF = Food Poverty Line ZN=Non-food Poverty Line
How to calculate the Food Poverty Line • Calculate average household (HH) size • Find minimum requirement of daily per-capita calories for WHO • Find the typical food bundle of the relative poor HH • Calculate the calories of this food bundle • Determine the cost of this food bundle WHO’s average minimum ZF = calorie requirement calories in average food bundle for relatively poor HH Cost of the average food bundle *
How to Calculate the Non-food Poverty Line • Find typical Household (HH) on the food poverty line. • Calculate the non-food expenditures of the HH. xF = per capita expenditures on food XN = per capita expenditure on non-food X = total per capita expenditure ZN = E {XN|xF= ZF} for the poor (Non-food poverty line is the per capita non-food expenditure level when the per capita food expenditure level is equal to the food poverty line) ZN = E {XN|x= ZF} for the ultra (extreme) poor (The non-food poverty line is given by the per capita non-food expenditure when the total expenditure is equal to the food poverty line. The food poverty line in essence becomes the total poverty line for the ultra poor) Z = ZF+ ZN
Minimum daily caloric requirements by sector and gender Urban Rural Age categories Male Female Male Female 0 to 1 year 820 820 820 820 >1 to 2 years 1,150 1,150 1,150 1,150 >2 to 3 years 1,350 1,350 1,350 1,350 >3 to 5 years 1,550 1,550 1,550 1,550 >5 to 7 years 1,850 1,750 1,850 1,750 >7 to 10 years 2,100 1,800 2,100 1,800 >10 to 12 years 2,200 1,950 2,200 1,950 >12 to 14 years 2,400 2,100 2,400 2,100 >14 to 16 years 2,600 2,150 2,600 2,150 >16 to 18 years 2,850 2,150 2,850 2,150 >18 to 30 years 3,150 2,500 3,500 2,750 >30 to 60 years 3,050 2,450 3,400 2,750 >60 years 2,600 2,200 2,850 2,450 Source: Caloric requirements are from WHO (1985, Tables 42 to 49). Notes: Requirements used are for men weighing 70 kilograms and for women weighing 60 kilograms. Urban individuals are assumed to need 1.8 times the basal metabolic rate (BMR), while rural individuals are assumed to need 2.0 times the average BMR. Children under one year of age are assigned the average caloric need of children either 3–6, 6–9, or 9–12 months old.
Poverty lines and spatial price indexes by region Food poverty line Reference poverty line Ultra poverty line Relative price index Region Metropolitan 50.18 75.36 129 .19 1.000 101 .72 Lower urban 45.94 67.52 0.787 Lower rural 44.29 85 .38 0.661 64.71 Upper urban 101.36 45.19 0.785 67.51 82.81 Upper rural 40.36 53.37 0.641 Notes: Poverty lines are monthly, per capita figures in Egyptian pounds. The Metropolitan poverty line is used as a base line to create the relative price index, which is simply the ratio of each region's reference poverty line to the base line.
Issues in the Poverty Line • Does a poverty line exists? • Can it be used & is it well accepted? • Are international standards for setting poverty lines accepted in all countries? • Can we use the same poverty line throughout a country? • Can the nutritional basket underlying the poverty line be derived from surveys?
Measures of Poverty • Incidence of Poverty: poverty rate • Use the headcount rate to calculate the poverty rate of the % of population below the poverty line • Depth of Poverty – how far a person is below the poverty line • Poverty Gap – aggregation of depth of poverty • Poverty Severity – aggregation with weights
Head-count Index of Poverty • Proportion of population whose consumption (y) is less than the poverty line Z Y1, Y2,..…Z, ..…Yn q H =q/n H = Head-count index q = number of poor n = size of the population Eg: if n=100; q=50 then H=0.5 or 50% • Problems • Insensitive to the depth of poverty • H will not change when a poor persons welfare changes if he/she remains below the poverty line
Example of the Head-count Index Calculation Income of 4 individuals in a sample: 1,2,3,4 Poverty Line Z = 3.0 H = q/n =3/4 = 0.75 or 75%
Head-count of Absolute Poverty for Bangladesh * BSS 1991 and BSS 1995
Poverty Gap Index (PGI) • Aggregate short-fall of the poor relative to the poverty line Z Y1, Y2,…, Yq; Yq Z Poorest Least poor q PG = 1/n Σ [(Z-Yi)/Z] = mean proportionate i=1poverty gap across the whole population (zero gap for the non=poor)
Example of Poverty Gap Calculation Income of4 individuals in a sample: 1,2,3,4 Poverty line = Z = 3; n=4 PG = [(3-1)/3 + (3-2)/3]/4 = [(2/3) + (1/3)]/4 = [(3/3)/4] = ¼ or 0.25 Poverty gap index does not capture differences in severity of poverty.
Why? Region A = (1,2,3,4) Region B = (2,2,2,4) Poverty line = Z = 3 HA = 0.75 HB = 0.75 PGA = 0.25 PGB = 0.25 Poverty gap will be unaffected by an income transfer from a poor person to another poor person who remains below the poverty line
Squared Poverty Gap Index (SPG) • Mean of the squared proportionate poverty gap • Reflects severity of poverty • Sensitive to the distribution among the poor q SPG = 1/n Σ [(Z-Yi)/Z]2 i=1 Eg: Region A = (1,2,3,4) Region B = (2,2,2,4) with Z=3 SPGA = 0.14 SPGB = 0.08 Poverty in region A > Poverty in region B
Poverty AnalysisIncome/Consumption Poverty Profile • Correlates poverty with: • Gender • Age • Residential location • Ethnic characteristics • Income source • Employment sources • Share of food/ non food consumption • Education outcomes • Malnutrition outcomes
Qualitative Analysis of Poverty • Role of informal sector? • Social analysis of poverty? • Institutional analysis of poverty reducing institutions • Intra-household distribution of resources
Use of Qualitative Methods • Subjective meaning of poverty • Intra-household dimensions of poverty • Poor people’s priorities for action • Social, political, and cultural factors, gender roles, and traditional beliefs • Participants help in designing household surveys • Assess the validity of HHS results at local level
Income or Consumption? • Consumption reflects income as well as past savings, access to credit markets, and seasonal variation in income • No records of income or seasonal fluctuations • Large informal sectors • Consumption data helps in deriving the poverty line
Measuring Income/ Consumption Poverty • Household data availability – tools • Measurement of income poverty • Quantitative analysis tools • Qualitative analysis tools • Income poverty dynamics – tools
Data Needs for Poverty Analysis • National level data • National accounts – GDP, consumption, savings, investment, imports, exports, etc. • Ministry of Finance, Central Statistical Agency • Budgets, price surveys, and data collection • Monthly, quarterly, and yearly
Data Needs for Poverty Analysis cont. • Local level data • Consumer and producer prices, climatic data, availability and use of markets and services • CSA, local service providers, regional departments • Price and market surveys • Monthly, yearly
Data Needs for Poverty Analysis cont. • Household – Individual level data • Household income, consumption, employment, assets, production, demography, etc. • CSA, sectoral ministries, NGOs, academics • Household survey, rapid assessments, monitoring and evaluation • Yearly, 2-3 years, every 5 years
Data Sources for Poverty Analysis • Administrative data • Population Census • Household surveys – LSMS, I&E, Labor, DHS, RRA • Qualitative and Participatory Assessments – ethnographic, village studies, beneficiary assessments, etc.
Types of Household Surveys • Single-topic surveys • Multi-topic surveys • Census data • Poverty monitoring surveys • Times series data • Panel data sets