Download
1 / 23
230 likes | 250 Views
This presentation outlines the project overview, requirement specifications, project plan, cost estimation, quality assurance, and a demonstration of a Virtual Pipeline Simulation Testbed. The goal is to design a GUI for pipeline system manipulation, implement an optimizer for efficient computation distribution, and integrate it with a simulator to mimic real pipeline behavior.

E N D
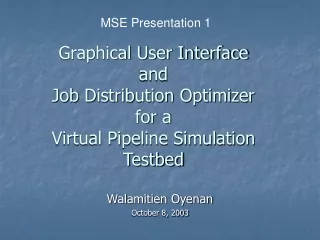
MSE Presentation 1 Graphical User Interface and Job Distribution Optimizerfor aVirtual Pipeline Simulation Testbed Walamitien Oyenan October 8, 2003
Presentation Outline • Project Overview • Requirement Specifications • Project Plan • Cost and Size Estimation • Quality Assurance • Demonstration
Project Overview Purpose: • Simulate the pressure and the flow rate distribution of gas in a real pipeline system.
Project Overview Goals: • Design a GUI to create and manipulate the pipeline system. • Implement an optimizer to efficiently distribute computation among several machines. • Integrate the GUI with a simulator that will simulate the behavior of each component of the real pipeline system.
Requirement Specifications-Overall Description User Interface • The pipeline editor shall support drag and drop operations for drawing components (pipes, joints, and compressors). • The pipeline editor shall support standard editing functions (copy, cut, paste). • The pipeline editor shall provide zoom functions. • The pipeline editor shall display the simulation results.
Requirement Specifications- Overall Description User Interface, cont. • The user shall be able to store/retrieve a previously drawn pipeline system and connect it with some new groups or components. • The user shall be able to move components inside the editor to have a better positioning. • The user shall be able to edit the characteristic of each component displayed.
Requirement Specifications- Overall Description Software Interfaces • The cluster computers shall run under the Linux operating system. • Each computer shall have the Java Virtual Machine installed (version 1.4 or later). • Each computer shall have the JGraph 3.0 package installed.
Requirement Specifications- Overall Description User Characteristics: • Users of the system should be experienced pipeline design engineers who have a good understanding of a pipeline system. • Users should be able to understand and manipulate pipeline characteristics. • No particular training should be necessary to use the software.
: User : Pipeline Editor : Optimizer : Simulator Drag component Display component Optimize () Optimize (Graph) BuildJobGraph(graph) Optimize(JobGraph) WriteFile(jobsLists) Simulate(JobsFilename) Simulate() ReadFileJobsFilename() simulate() Send(SimulationData) Display Data
Requirement Specifications- Functional Requirements Pipeline Editor • Components: Pipes, split, station, driver, compressor, orifice… • Draw, Edit, Delete, Move • Undo, Redo • Copy, Cut, Paste • Zoom In, Zoom out • Optimize • Simulate
Requirement Specifications- Functional Requirements Optimizer • Problem: Produce an optimal job allocation that balances the load of each processor (=minimizes the load differences among cluster machines assigned to the simulation). • The jobs are the pipelines components (pipes, joints, compressors …). • Each job has a computation time and a communication time that depend on the characteristic of the component it represents. • Solution: Branch and Bound Algorithm
Requirement Specifications • For more details, see the Software Requirement Specification (SRS) document.
Project Plan • Phases Phase 1 Phase 2 Phase 3 Jul Aug Sep Oct Nov Dec Jan
Cost Estimation • Effort = 3.2 EAF (Size)^1.05; • Time = 2.5 (Effort)^0.38; Where: • Effort = number of staff-months • EAF = Effort Adjustment Factor (cf. Table) • Size = number of delivered source instructions (in thousands of lines of code)
Cost Estimation Software Development Effort Multipliers (EAF)
Cost Estimation (cont.) • EAF = 1.00 x 1.00 x 1.00 x 1.11 x 1.00 x 1.00 x 1.00 x 1.00 x 1.00 x 1.00 x 1.00 x 1.07 x 0.91 x 1.10 x 1.10 = 1.31 • KLOC = 2 (2,000 SLOC) (Estimation) • E = 3.2 x 1.31 x 2^1.05 = 8.67 staff-months • Time = 2.5 x 8.67^0.38 = 5.68 months
Software Quality Assurance Plan Organization • Committee of 3 professors to supervise the project: Dr. Virgil Wallentine, Dr. Daniel Andresen, Dr. Masaaki Mizuno • Approve design and requirements. • Responsible for monitoring implementation progress.
Software Quality Assurance Plan Standards, conventions, and tools • The documentation will be based upon IEEE Software Engineering Standards. • JGraph3.0 and Swing libraries will be used to build the Pipeline Editor (GUI). • Rational Rose will be used to visually design the software being developed. • Java Path Finder (JPF) will be used as a verification tool.
Demonstration • Demonstration of the GUI prototype
THE END. • Questions • Comments • Suggestions