Download
1 / 22
220 likes | 317 Views
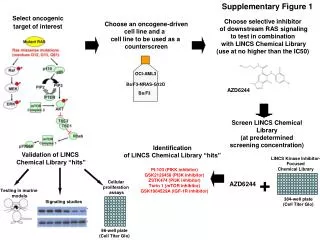
Screen LINCS Chemical Library for hits to inhibit RAS signaling, validate hits using cellular assays, and test combination therapies. Includes oncogene-driven cell lines and inhibitors for targeted treatment.

E N D
Supplementary Figure 1 Select oncogenic target of interest Choose selective inhibitor of downstream RAS signaling to test in combination with LINCS Chemical Library (use at no higher than the IC50) Choose an oncogene-driven cell line and a cell line to be used as a counterscreen OCI-AML3 Ba/F3-NRAS-G12D Ba/F3 AZD6244 Screen LINCS Chemical Library (at predetermined screening concentration) Identification of LINCS Chemical Library “hits” Validation of LINCS Chemical Library “hits” LINCS Kinase Inhibitor- Focused Chemical Library PI-103 (PIKK inhibitor) GSK2126458 (PI3K inhibitor) ZSTK474 (PI3K inhibitor) Torin 1 (mTOR inhibitor) GSK1904529A (IGF-1R inhibitor) + Cellular proliferation assays AZD6244 Testing in murine models 384-well plate (Cell Titer Glo) Signaling studies 96-well plate (Cell Titer Glo)
A Supplementary Figure 2 parental Ba/F3 120 Ba/F3-NRAS-G12D OCI-AML3 100 80 60 Percentage of viable cells 40 20 0 PD0325901 (MEK inhibitor) GSK2126458 (PI3K Inhibitor) GSK1120212 (MEK Inhibitor) AZD8330 (MEK inhibitor) C B 120 120 100 100 80 80 Cell Number (% of Control) Cell Number (% of Control) 60 60 40 40 20 20 0 0 0 18.75 37.5 75 150 300 0 18.75 37.5 75 150 300 [Drug, nM] [Drug, nM]
Supplementary Figure 3 C A B AZD6244 (20-40) 120 PI-103 (37.5-75) 120 120 AZD6244 (20-40) AZD6244 (20-40) Combination (AZD=5-10; PI=9.375-18.75) 100 ZSTK474 (150-300) 100 GSK2126458 (10-20) Combination (AZD=5-10; ZST=18.75-37.5) 100 Combination (AZD=5; GSK=2.5) 80 80 80 Cell Number (% of control) Cell Number (% of control) 60 Cell Number (% of control) 60 60 40 40 40 20 20 20 Ba/F3-NRAS-G12D Ba/F3-NRAS-G12D Ba/F3-NRAS-G12D 0 0 0 0 2.5 5 10 20 40 80 AZD6244 0 5 10 20 40 80 160 0 2.5 10 20 40 80 AZD6244 AZD6244 5 ZSTK474 0 9.375 18.75 37.5 75 150 300 GSK2126458 0 1.25 2.5 5 10 20 40 PI-103 0 18.75 9.375 37.5 75 150 300 Combination Combination 0 2.5+ 9.375 5+ 18.75 40+ 150 0 2.5+ 1.25 20+ 10 40+ 20 20+ 75 5+ 2.5 10+ 5 Combination 10+ 18.75 0 5+ 9.375 40+ 75 80+ 150 10+ 37.5 80+ 300 80+ 40 20+ 37.5 160+ 300 [Drug, nM] [Drug, nM] [Drug, nM] D E F 120 AZD6244 (20-40) AZD6244 (20-40) 120 120 Torin 1 (80-160) ZSTK474 (150-300) AZD6244 (20) 100 Combination (AZD=5-10; ZST=18.75-75) 100 P1013 (40-80) Combination (AZD=10; Torin1=2.5) 100 Combination (AZD=5-10; PI=9.375-18.75) 80 80 80 Cell Number (% of control) Cell Number (% of control) Cell Number (% of control) 60 60 60 40 40 40 20 20 OCI-AML3 20 OCI-AML3 OCI-AML3 0 0 0 0 2.5 5 10 20 40 80 AZD6244 AZD6244 0 5 10 20 40 80 160 0 5 10 20 40 80 160 AZD6244 ZSTK474 0 9.375 18.75 37.5 75 150 300 P1013 0 9.375 18.75 37.5 75 150 300 Torin1 0 1.25 2.5 5 10 20 40 0 2.5+ 9.375 5+ 18.75 20+ 75 40+ 150 Combination 10+ 37.5 80+ 300 0 5+ 9.375 10+ 18.75 80+ 150 40+ 75 20+ 37.5 160+ 300 20+ 5 Combination 0 5+ 1.25 10+ 2.5 40+ 10 80+ 20 160+ 40 [Drug, nM] [Drug, nM] [Drug, nM]
Supplementary Figure 4 Ba/F3-NRAS-G12D (RPMI+10% FBS) Ba/F3-NRAS-G12D (RPMI+10% FBS) A B Cell Number (% of Control) Cell Number (% of Control) [Drug, nM] [Drug, nM] Ba/F3-NRAS-G12D (15% WEHI (source of IL-3) Ba/F3-NRAS-G12D (15% WEHI (source of IL-3) D C Cell Number (% of Control) Cell Number (% of Control) [Drug, nM] [Drug, nM]
Supplementary Figure 5 A B C F D E
Supplementary Figure 6 (A-E) A B OCI-AML3 NB4 Percentage Percentage C D E HEL SKM-1 NOMO-1 Percentage Percentage Percentage
Supplementary Figure 6 (F-I) G F OCI-AML3 NB4 Percentage Percentage H I SKM-1 NOMO-1 Percentage Percentage
Supplementary Figure 6 (J-L) J 24 hr 60 50 40 G0G1 Percentage 30 G2M S 20 10 0 Control GSK1904529A AZD6244 GSK1904529A+ AZD6244 48 hr 48 hr K L subG1 45 40 35 Percentage 30 Percentage 25 20 15 10 5 0 Control GSK1904529A Control GSK1904529A AZD6244 GSK1904529A+ AZD6244 AZD6244 GSK1904529A+ AZD6244
Supplementary Figure 6 (M) M 72 hr Percentage Control GSK1904529A GSK1904529A+ AZD6244 AZD6244
Supplementary Figure 6 (N) N AZD6244 (300 nM) GSK1904529A (300 nM) AZD6244+ GSK1904529A Control MOLM14 NB4 OCI-AML3
Supplementary Figure 7 (part 1) SKM-1 (RPMI+10%FBS) SKM-1 (95% HS-5 SCM) SKM-1 (95% HS27a SCM) Cell Number (% of Control) Cell Number (% of Control) Cell Number (% of Control) [Drug, nM] [Drug, nM] [Drug, nM] NB4-luc+ (RPMI+10%FBS) NB4-luc+ (95% HS-5 SCM) NB4-luc+ (95% HS27a SCM) Cell Number (% of Control) Cell Number (% of Control) Cell Number (% of Control) [Drug, nM] [Drug, nM] [Drug, nM]
Supplementary Figure 7 (part 2) OCI-AML3 (RPMI+10%FBS) OCI-AML3 (95% HS-5 SCM) Cell Number (% of Control) Cell Number (% of Control) MOLM14 [PKC412, nM] [Drug, nM] [Drug, nM] Cell Number (% of Control) NOMO-1 (RPMI+10%FBS) NOMO-1 (95% HS27a SCM) Cell Number (% of Control) Cell Number (% of Control) [Drug, nM] [Drug, nM]
Supplementary Figure 8 Normalized growth Treatment
Supplementary Figure 9 A 160 Parental Ba/F3 140 120 100 80 Cell Number (% of Control) 60 GSK1904529A (>300) 40 ZSTK474 (>300) Combination (>300) 20 0 0 4.7 GSK1904529A 9.4 18.75 37.5 75 150 300 0 4.7 9.4 18.75 37.5 75 150 300 ZSTK474 [Drug, nM] B C 160 160 Ba/F3-NRAS-G12D Ba/F3-KRAS-G12D 140 140 GSK1904529A (>300) ZSTK474 (150-300) GSK1904529A (37.5) 120 120 Combination (37.5) ZSTK474 (150) Combination (9.4-18.75) 100 100 Cell Number (% of Control) Cell Number (% of Control) 80 80 60 60 40 40 20 20 0 0 4.7 300 9.4 0 18.75 37.5 75 150 GSK1904529A 4.7 GSK1904529A 9.4 0 18.75 37.5 75 150 300 0 4.7 9.4 18.75 37.5 75 150 300 ZSTK474 0 4.7 9.4 18.75 37.5 75 150 300 ZSTK474 [Drug, nM] [Drug, nM]
Supplementary Figure 10 Ba/F3-NRAS-G12D Ba/F3-KRAS-G12D A B Ba/F3 OCI-AML3 NOMO-1 MOLM14 SKM-1 NB4 HEL C D OCI-AML3 NOMO-1 MOLM14 OCI-AML3 SKM-1 MOLM14 NB4 HEL NOMO-1 SKM-1 NB4 HEL Phospho-IGF1Rb/ Total IGF1Rb 2.1 0.7 1.2 1.8 0.89 1.39
B A Control AZD6244 (37.5 nM) GSK- 1904529A (37.5 nM) Combi- nation GSK- 1904529A (300 nM) NVP- AEW541 (300 nM) AZD6244 (300 nM) AZD6244 + NVP- AEW541 AZD6244 + GSK- 1904529A Control Supplementary Figure 13
Supplementary Figure 14 (Ser 65) 300 nM GSK1904529A 300 nM AZD6244 AZD6244+NVPAEW541 300 nM NVPAEW541 Control AZD6244+ GSK1904529A
Supplementary Figure 15 Cell Number (% of no treatment control) A B 120 80 NB4 Absorbance (560 nm) 100 70 NB4 60 80 GFP Control 50 60 IGF-1R hp1 40 30 IGF-1R hp2 40 20 10 20 0 0 GFP Control IGF-1R hp1 IGF-1R hp2 0 0 0 AZD6244 (18.75 nM) AZD6244 (75 nM) AZD6244 (37.5 nM) GSK1904529A (18.75 nM) GSK1904529A (37.5 nM) GSK1904529A (75 nM) Combination Combination Combination C D Absorbance (560 nm) 80 Cell Number (% of no treatment control) HEL 120 HEL 70 100 60 80 GFP Control 50 60 IGF-1R hp1 40 40 IGF-1R hp2 30 20 20 10 0 0 0 AZD6244 (18.75 nM) GFP Control IGF-1R hp1 IGF-1R hp2 GSK1904529A (18.75 nM) Combination E F
Supplementary Figure 16 A NVPAEW541+ AZD6244 NVPAEW541 AZD6244 B Grams NVPAEW541 AZD6244 NVPAEW541+ AZD6244
* Cell Number (% of Control) NVPAEW541 (300 nM) AZD6244 (300 nM) NVPAEW541 (300 nM) + AZD6244 (300 nM) Supplementary Figure 17


