Download
1 / 37
380 likes | 500 Views
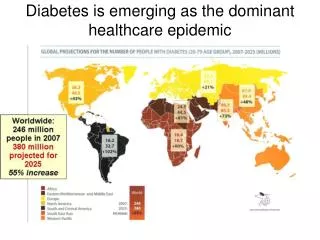
Diabetes is emerging as the dominant healthcare epidemic. Source: Diabetes Atlas 3rd Edition. www.eatlas.idf.org. Last accessed 25 January 2007. SA prevalence Diabetes = 5.5% Direct cause of death = 4.3% Contributory to 14% IHD, 12% hypertensive, 12% renal + 10% stroke deaths

E N D
Diabetes is emerging as the dominant healthcare epidemic Source: Diabetes Atlas 3rd Edition. www.eatlas.idf.org. Last accessed 25 January 2007
SA prevalence Diabetes = 5.5% Direct cause of death = 4.3% Contributory to 14% IHD, 12% hypertensive, 12% renal + 10% stroke deaths Glycemic Control: 37% of patients have HbA levels < 7.0% Metabolic Control: 20% achieve HbA + BP + Lipid targets The Tale of Two Epidemics AIDS RELATED DEATHS 1990 - 2009 (SAMJ 2007) (UNAIDS 2010)
Absolute No (m) Mortality Rank Mortality Growth Rate ARV vs OHA/Ins (%) VL vs HbA control (%) Medication vintage Advocacy 1 Advocacy 2 6 vs 4 1 vs 6 1 vs 3 37 vs 66 90 vs 30 2010 vs 1947 TAC vs SA Diabetes Guidelines HIV vs DM HIV vs DM in SA
Cost of DM Care • US 2006: $1 in $7 / $ 200 billion • OPD: 15% / consultations / laboratory / medications • In-Patients: 85% / complications / investigations / procedures / medications
Many patients Many undiagnosed Few health personnel Poorly skilled personnel Poorly resourced clinics Reduced patient contact time (40 min per year) Poor uptake / application of lab testing (30 % have regular tests) Delay in treatment change / up-titration Sub-optimal medication Poor Glucose Control in SA
Diabetes “Re-thinking the Failure”
Defining Mental Retardation “ achieve no result, persist in doing the same and expect and different outcome” (Albert Einstein)
UKPDS 35: Higher HbA1c is associated with increased micro- and macrovascular complications in T2DM Each 1% rise in mean HbA1c was associated with 21% risk increase for any diabetes endpoint (p<0.0001) 21% risk increase for diabetes-related mortality (p<0.0001) 14% risk increase for myocardial infarction (MI) (p<0.0001) 37% risk increase for microvascular complications (p<0.0001) 140 120 100 80 60 40 20 0 Any diabetes endpoint Microvascularcomplications Adjusted event rate / 1,000 person years Diabetes-related morbidity MI <6% 67% 78% 89% 910% ≥10% Mean HbA1c concentration (%) Stratton IM, et al. BMJ 2000;321:405–12
Insulin Resistance Pre-Diabetes Diabetes > 5.6 mmol/l > 6.0 mmol/l > 7.0 mmol/l Diagnosis – Fasting Glucose
Parameter Weight Loss Exercise Success Rate < 5 % < 5 % T2 DM and Primary Prevention
Type 2 Diabetes and Primary Prevention ADA CONCENSUS 2007 TREAT PRE-DIABETES (IFG / IGT) LIFESTYLELIFESTYLE + METFORMIN Age < 60 y Risk Factors (BP, Lipids, BMI) HbAic > 6 % Cost Analysis DPP 10 y FU: Lifestyle vs Metformin:: +$1500 vs -$30[ADA 71st 2011]
Effects of intensive glucose lowering in T2DM ACCORD Standard therapy Intensive therapy 9.0 8.5 8.1% 8.0 7.5% HbA1c (%) 7.5 7.0 6.4% 6.5 6.0 0 0 1 2 3 4 6 5 Years Gerstein et al. N Engl J Med 2008;358:2545–59
Effects of intensive glucose lowering in T2DM ACCORD Standard therapy Intensive therapy 25 25 • First occurrence of non-fatal MI, non-fatal stroke or CV death Death from any cause 20 20 • HR (CI) 0.90 (0.78, 1.04) • p=0.16 • HR (CI) 1.22 (1.01, 1.46) • p=0.04 15 15 Patients with events (%) 10 10 5 5 0 0 0 1 2 3 4 0 5 6 1 2 3 4 5 6 Years Years Gerstein et al. N Engl J Med 2008;358:2545–59
Side-effects of intensive glucose lowering ACCORD Standard therapy Intensive therapy p-value Hypothesis: 261 (5.1) <0.001 830 (16.2) Hypoglycaemia* N (%) Weight gain >10kg N (%) 713 (14.1) <0.001 1399 (27.8) 70% of non-insulin-treated and 60% of insulin-treated patients were taking three or more oral antidiabetic drugs at study end Drug interaction *hypoglycaemia defined as requiring any assistance Gerstein et al. N Engl J Med 2008;358:2545–59
Potential mechanisms of hypoglycaemia-induced mortality • Cardiac arrhythmias due to abnormal cardiac repolarisation in high-risk patients (IHD, cardiac autonomic neuropathy) • Increased thrombotic tendency/decreased thrombolysis • Cardiovascular changes induced by catecholamines • Increased heart rate • Silent myocardial ischaemia • Angina and myocardial infarction
GLP 1 Mimetics The Virtuous Therapeutic Cycle GLUCOSE CONTROL WEIGHT LOSSNOHYPOGLYCEMIA HbA = 7 %
Diabetes Therapy - Safety • Hypoglycemia • Weight gain • CVS mortality • Cancer
Strategic Rx ADVERSEPOSITIVE
Metformin (UKPDS) Rosi / TZD (RECORD) Tolbu / SU (UGDP) MI reduction 39% (vs insulin / chlor / gliben MI increased (OR 1.43) CV mortality increased by 30% OHA and CV Protection
SU vs Met (Schramm T et al, Eur Heart J, April 2011) [Conclusion: Metformin = protective? vs some SU bad?]
DM and Cancer Medications for DM can affect cancer risk and outcome - ? Insulin ? Pioglitazone Metformin reduces cancer risk Sulfonylurea: probably no effect GLP-1 agonists: currently unknown but seemingly safe
GLP-1 and DPP-41 DPP-4 His Ala Glu Gly Thr Phe Thr Ser Asp Plasma t½ = 1–2 min (IV) CL = 5–10 L/min Val 7 9 Ser Lys Ala Ala Gln Gly Glu Leu Tyr Ser Glu 36 Phe Ile Ala Trp Leu Val Lys Gly Ala NH2 CL=clearance rate; DPP-4=dipeptidyl peptidase-4; GLP-1=glucagon-like peptide-1; IV=intravenously. 1. Vilsbøll T et al. J Clin Endocrinol Metab. 2003;88(1):220–224
DPP 4 Sitagliptin ^ Vildagliptin* Alogliptin Saxagliptin GLP1 Exenatide* Liraglutide ^ Exenatide LAR Albuglutide Taspoglutide Incretin Therapy [*Available / ^ Imminent in SA]
Stimulates insulin secretion Insulin secretion is glucose dependent Inhibits glucagon secretion Increases beta cell mass Delays gastric emptying Inhibits appetite Secretogogue No hypoglycemia Reduces meal-related glucose peaks Maintains beta cell reserve Reduces meal-related peaks; reduces weight Reduces weight Incretin - GLP 1 Therapy
Liraglutide in combination with metformin presents a low risk of hypoglycaemia 1.4 1.2 1 0.8 Minor hypos/patient/year 0.6 0.4 0.2 0 Liraglutide 1.2 mg Liraglutide 1.8 mg Placebo Glimepiride • Minor hypoglycaemic events are at the placebo level (LEAD 2, above) • There is a small but increased risk of minor hypoglycaemia when combined with SUs (1.0 events per subject every second year; LEAD 1) Nauck et al, Diabetes Care, published online 10.23 37/dc08-1355 (LEAD 2) and Marre et al. Diabetes 2008;57(Suppl. 1):A4 (LEAD 1).
A quarter of patients lose an average of 7.7 kg with liraglutide Weight change (kg) Q3-Q4 Liraglutide 1.8 mg + met 0–Q1: mean weight change for the 25% of subjects who had the largest weight loss Q1–Q2: mean weight change for the 25–50% weight loss quartile Q2–Q3: mean weight change for the 50–75% weight loss quartile Q3–Q4: mean weight change for the 75–100% weight loss quartile, that is, the 25% who had the smallest weight loss Nauck et al, Diabetes Care, published online 10.23 37/dc08-1355 (LEAD 2).
Sustained weight reduction over 52 weeks with liraglutide ***p<0.0001 for change from baseline • Waist circumference was reduced from baseline by 3.0 cm with liraglutide 1.8 mg • Waist circumference increased by 0.4 cm with glimepiride (p<0.0001) 52 *** *** Glimepiride 8 mg/day Liraglutide 1.2 mg/day Liraglutide 1.8 mg/day Garber et al, The Lancet, early online publication, 25 Sept 2008 (LEAD 3).
Liraglutide reduces visceral body fat Visceral vs. subcutaneous fat CT scan Change in body fat DEXA scan Visceral Subcutaneous 3 +1.1 kg (+0.4%) 10 +3.4 2 5 1 0 0 Change in percentage fat (%) 5 Change in body fat, kg (%) -1 -10 -7.8* -4.8 -8.5* -15 -2 -20 -3 -1.6* (-1.1%*) -16.4 -2.4* (-1.2%*) -25 -4 -17.1 Liraglutide 1.2 mg + met Liraglutide 1.8 mg + met Glimepiride + met • Two thirds of weight lost was fat tissue (liraglutide 1.8 mg) Data are mean±SEM; *p<0.05 vs. glim+met; n=160. LEAD 2 substudy, originally presented as Jendle et al. Diabetes 2008;57(Suppl. 1):A32.
Liraglutide improves beta-cell function as measured by HOMA-B and proinsulin:insulin ratio Baseline 56.4% 70.6% 45.5% 56.3% 0.48 0.45 0.45 0.42 p=0.0313 p=0.0033 Change in proinsulin:insulin HOMA (%) Liraglutide 1.8 mg Liraglutide 1.2 mg Rosi-glitazone Placebo Liraglutide 1.8 mg Liraglutide 1.2 mg Rosi-glitazone Placebo Marre et al. Diabetes 2008;57(Suppl. 1):A4 (LEAD 1). Data are mean±2SE.
Pre-Diabetes CVD Protection Cancer Hypoglycemia Weight Disease Modifying Metformin Metformin, TZD, GLP1 Metformin Metformin, TZD, GLP1 Metformin, GLP1 GLP1 Diabetes Care – Future?