Download
1 / 19
190 likes | 309 Views
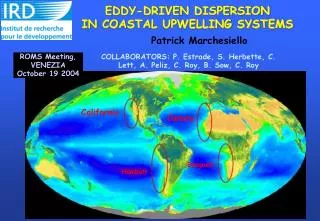
Regulation of seasonal primary production in eastern boundary upwelling systems. Monique Messié & Francisco Chavez Monterey Bay Aquarium Research Institute. Regulation of seasonal primary production in eastern boundary upwelling systems. Monique Messié & Francisco Chavez

E N D
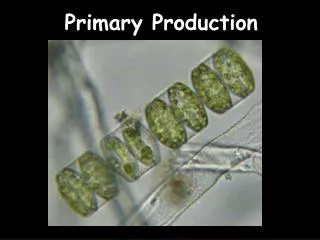
Regulation of seasonal primary productionin eastern boundary upwelling systems Monique Messié & Francisco Chavez Monterey Bay Aquarium Research Institute
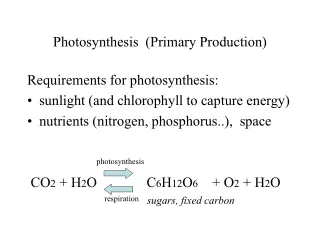
Regulation of seasonal primary productionin eastern boundary upwelling systems Monique Messié & Francisco Chavez Monterey Bay Aquarium Research Institute 150 km surface regenerated primary production regeneration (NH4+) new nitrate supply(NO3-) mixed layer depth coast nitrate supply (N flux) ↔ potential new production (C flux)
Average primary production vs. potential new production (nitrate supply)
1. The N-ratio concept Comparing satellite-derived primary production (Behrenfeld & Falkowski, 1997) primary production and nitrate supply from satellite winds and in-situ nitrate (Messié et al., 2009) wind 150 km surface regenerated primary production regeneration (NH4+) new nitrate supply(NO3-) mixed layer depth Ekmanpumping X = Nitrate supply nitrate atdepth(60m) coast coastal transport
1. The N-ratio concept Comparing satellite-derived primary production (Behrenfeld & Falkowski, 1997) primary production and potential new production carbon-equivalent of nitrate supply assuming C:N = 106:16 (Messié et al., 2006) wind Potential new production = new production that would be achieved if all nitrate supplied was consumed 150 km surface regenerated primary production regeneration (NH4+) new nitrate supply(NO3-) mixed layer depth Ekmanpumping X = Nitrate supply nitrate atdepth(60m) coast coastal transport
1. N-ratio concept Seasonal primary production PP latitude time
1. N-ratio concept Seasonal primary production vs. potential new production NPpot PP latitude time
1. N-ratio concept RP = regenerated production NP = new production f-ratio = (Eppley & Peterson, 1979) • N-ratio = N-ratio = f-ratio ifall nitrate suppliedisconsumed N-ratio =f-ratio+ 150 km RP surface f-ratio * PP N-ratio * PP potential RP accumulation RP primary production regeneration (NH4+) photo-synthesis available N NP potential NP offshore export N-remain nitrate supply(NO3-) non-used nitrate mixed layer depth coast subduction
1. N-ratio concept f-ratio = (Eppley & Peterson, 1979) f-ratio ~ 0.5, constant • N-ratio = N-ratio =f-ratio+ f-ratios (Laws et al. 2000; Dunne et al., 2005) N-ratios (Eppley & Peterson, 1979)
f-ratios 1. N-ratio concept f-ratio ~ 0.5, constant N-ratios N-ratio > f-ratio remaining nitrate other factors regulating N-ratio = f-ratio all nitrate supplied is consumed nitrate regulating N-ratio ≤ 0.5 N-ratio ≥ 0.8 N-ratio = f-ratio + N-ratio Black contours = surface nitrate
2. The N-ratio analysis: nitrate vs. other factors N-ratio ? ? ? ? PP lower than expected from N-supply WHY? ? Nitrate regulation N-ratio ≤ 0.5 nitrate regulates PP (N-remain ~ 0) N-ratio ≤ 0.5 nitrate regulates PP (N-remain ~ 0) N-ratio ≥ 0.8 other factors regulate PP (N-remain > 0)
2. N-ratio analysis back to the definition of primary production… growth rate max growth rate 0 ≤ ≤ 1 limitation term PP, physical export, mortality, sinking, grazing PP, physical export, mortality, sinking, grazing Temperature, species Temperature, species Light, nutrients Light, nutrients (nitrate, iron) (nitrate) dust deposition, river runoff (Chase et al., 2007) 150 km surface Light Temperature EKE residence time Tbox Ironsupply Physical export biomass * growth Nitratesupply (Messié et al., 2006) wind-driven downwelling mixed layer depth coast shelf width Wshelf Data sources: QuikSCAT winds, ETOPO2 bathymetry, modeled dust from Mahowald et al. (2003), SST Reynolds, SeaWiFS PAR, AVISO sea level anomalies (Johnson et al., 1999)
A few words about physical export… only observed when computing Tbox up to Dupwell • Needs: • Tbox ≤ 8 days (Zimmerman et al., 1987; Wilkerson et al., 2006) • a mechanism to subduct within the box: EKE (increases offshore & vertical export of biomass & nutrients, Lathuilière et al., 2010; Gruber et al., 2011) and/or Ekman downwelling wind 150 km surface Dupwell downwelling upwelling mixed layer depth Ekmanpumping Ekmanpumping coast coastal transport (Ekman downwelling)
A few words about physical export… only observed when computing Tbox up to Dupwell Needs: Tbox ≤ 8 days (Zimmerman et al., 1987; Wilkerson et al., 2006) a mechanism to subduct within the box: EKE and/or Ekman downwelling + isopycnal advection, mixing & frontal convergence possible (Washburn et al., 1991; Bograd & Mantyla, 2005)
2. N-ratio analysis What explains the high N-ratios? • Iron regulation off NW Africa? • No iron regulation off Peru? • What about Benguela? Based on correlations w/ N-ratio, mean value in high N-ratios situations, difference in high vs. low N-ratio situations
3. Correlation analysis and PP regulation Example: California Spatial correlations with PP Seasonal cycles PP N-supply Wshelf / dust light temperature Tbox From N-ratio analysis: high N-ratios = physical export Winter: nitrate, light, temperature (Kudela and Dugdale, 2000) Spring: upwelling resumes, physical export (Bograd and Mantyla, 2005; Gruber et al., 2011) Late summer: iron regulation (Johnson et al., 2001; Elrod et al., 2008)
3. Correlation analysis and PP regulation Spatial correlations with PP NW Africa From N-ratio analysis: high N-ratios = iron High N-ratio narrow shelf Seasonal cycles Benguela From N-ratio analysis: high N-ratios = light/ export / iron
3. PP regulation high N-ratios Nitrate supply Iron supply Physical export Light
N-ratio as a tool to monitor nitrate regulation but also ecosystem efficiency PP regulation highly variable in space and time, concept of co-limitations Need for validation of iron limitation (NW Africa / Benguela) Conclusions Nitrate supply Iron supply Physical export Light