Download
1 / 1
20 likes | 256 Views
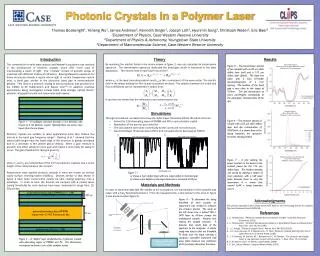
Photoluminescence in One Dimensional Photonic Crystals. Melt Pump A. AB Feedblock. Layer Multipliers. Extruder A. Extruder B. Melt Pump B. Transfer Tube. Surface Layer Extruder. Surface Layer Feedblock. Exit Die. Melt Pump. Skin layer. Core layers. Skin layer.

E N D
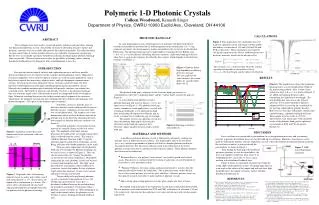
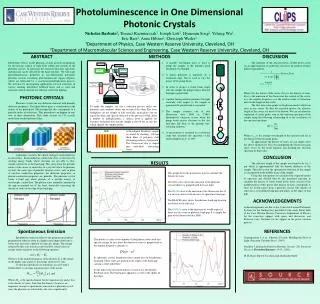
Photoluminescence in One Dimensional Photonic Crystals Melt Pump A AB Feedblock Layer Multipliers Extruder A Extruder B Melt Pump B Transfer Tube Surface Layer Extruder Surface Layer Feedblock Exit Die Melt Pump Skin layer Core layers Skin layer Nicholas Barbuto1, Tomasz Kazmierczak2, Joseph Lott2, Hyunmin Song2, Yeheng Wu1, Eric Baer2, Anne Hiltner2, Christoph Weder2, 1Department of Physics, Case Western Reserve University, Cleveland, OH 2Department of Macromolecular Science and Engineering, Case Western Reserve University, Cleveland, OH ABSTRACT METHODS DISCUSSION DFB • A Distributed Feedback sample is created by stacking ~100 nm thick films of polymers with alternating indices of refraction. The fluorescent dye is doped into individual, alternating layers. • A tunable wavelength laser is used to pump the sample at the dopant’s peak absorption wavelength . • A linear polarizer is mounted on a rotational stage. This is used to vary the power of the pump beam. • In order to project a round beam shape onto the sample, the pump beam is directed through a spatial filter. • Another linear polarizer polarizes the light vertically with respect to the sample to guarantee the polarization is consistent. • The sample contains one of two fluorescent dyes, R6G or C1RG. Spontaneous emission occurs when the pump beam excites electrons in the dye and then fall back to the ground state, releasing a photon. • A spectrometer is mounted on a rotational stage that measures the spectrum of the emitted light from 0° to ±90°. The intensity of the emission from a Fabry-Perot cavity (as an approximation to a photonic crystal) is the product of three different parameters. Where F is the finesse of the cavity, D(ω) is the density of states, E(ω) is the emission of the fluorescent dye outside of the cavity, ωis the angular frequency, n is the relative index of refraction, and d is the length of the cavity. The first term corresponds to the photon modes which can exist in any cavity. To find the expected modes, the effective length of the cavity, nd, needs to be known. We can calculate the separation of mode peaks seen in the emission spectrum of the sample using the following relationship fit to the oscillations of the emission spectrum. Where ωavg is the average wavelength of the emission and Δω is the distance between mode peaks. To approximate the density of states, we can simply solve the above equation for D(ω) by multiplying the fluorescent gain curve, E(ω), by the mode equation and dividing the emission spectrum by that value. Interference effects inside photonic crystals provide mechanisms for the precise control of light both within and outside of the photonic crystal. In particular the emission direction, spectrum, and intensity can be affected by the band structure. We will study photoluminescence properties in one-dimensional polymeric photonic crystals containing photoluminescent organic dopants, which are fabricated by a co-extrusion/multiplication process. We will also be investigating applications of such structures in surface emitting distributed feedback lasers and as color and emission control elements for efficient solid state lighting. 6 5 4 PHOTONIC CRYSTALS 3 Photonic crystals are any dielectric material with periodic dielectric properties. The figure below gives a visualization to the notion of the periodicity. Macroscopically this corresponds to a periodic index of refraction. This periodicity can happen in one, two, or three dimensions. This study focuses on 1-D crystals made from stacked polymer films. A photonic crystal is the optical analog to semiconductors in electronics. Semiconductors control the flow of electrons by creating energy bands where electrons are not able to flow, usually referred to as the band gap. This stems from the periodic nature of the atoms or molecules in a crystal lattice. In photonic crystals, the same type of periodic structure exists, only in place of electron conduction properties, the dielectric properties, or photon conduction properties are periodic. The photonic crystal forms a band gap where photons of a specific energy, or wavelength, cannot flow. The photon states normally contained in the gap are pushed out of the band, drastically increasing the density of states at the edge of the band gap. 2 To make the samples, we use a extrusion process melts two polymers and combines them, one on top of the other. The layer multipliers cut the sample in half vertically, again place one on top of the other, and spreads them out to the previous width. After a number of multiplications, a surface layer is applied for evenness and protection and the sample is forced out an exit die which spreads the sample further. 1 CONCLUSION RESULTS The effective length of the sample was found to be 6 ± 1 μm which is approximately half the known thickness of the sample. This tells us that the spontaneous emission of the sample is concentrated in the middle 6 μm of the sample. Using this information we calculated the expected modes of emission and divided that by the measured emission to calculate the density of states found in the lower section of the middle portion of this poster. The density of states corresponds to what we would expect from a photonic crystal. The density of states has a well defined band gap and spikes on the edges of that gap. This graph shows the parameters used to calculate the density of states. The RED curve shows the emission of the photonic crystal while it is pumped with the laser light. The BLUE curve is the emission of the fluorescent dye if it were in a cavity in the absence of a photonic band gap. The BLACK curve shows the photonic band gap location in relation to the emission. The GREEN curve is the emission we would expect if there was no cavity or photonic band gap. It is simply the gain of the fluorescent dye, R6G. ACKNOWLEDGEMENTS Acknowledgements are due to the Center for Layered Polymeric Systems for the funding they provided for the study, Brent Valle of the Case Western Reserve University Department of Physics for the consistent support with optics and discussion, and Professor Gary Chottiner for his support in the poster creation process. Spontaneous Emission REFERENCES Spontaneous emission refers to the quantum mechanical phenomenon when an atom in a higher state jumps down into a lower state and emits a photon of a specific energy. The energy released by this state transfer is governed by conservation of energy which manifests in the following equation. Where ω is the angular frequency of the photon, E2is the energy of the higher state and E1 is the energy of the lower state. To find the likelihood of a transition, we use Fermi’s Golden Rule to calculate transition rates of the atoms. Where M12 is the matrix element for the transition rate and g( ħω) is the density of states. Note that the density of states is an important concept to spontaneous emission in a photonic crystal since the photonic crystal modifies the states significantly. Joannopoulous J. et al. Photonic Crystals: Molding the Flow of Light. Princeton Univerity Press. (1995) Ouellette J. Seeing the Future in Photonic Crystals. The Industrial Physicist. December/January: 14-17. (2002) M. H. Bartl. http://www.chem.utah.edu/faculty/bartl/ The density of states is the number of final photon states with that specific energy. In free space the density of states is proportional to the angular frequency squared, or: In a photonic crystal, the photon states cannot exist in the photoinc band gap. Those states get pushed to the edges of the band gap causing a large spike there. To the right is the measured density of states for a Distributed Feedback laser. The band gap is apparent, as well as the spikes on the edges.