Photometry
Photometry. Photometry measures the energy from a source using a narrow range of wavelengths. Visual wavelengths from 400-700 nm Narrower slice of wavelengths Photometry uses filters to select wavelengths. Spectroscopy measures energy over a wide range of wavelengths. Visual spectrum

Photometry
E N D
Presentation Transcript
Photometry measures the energy from a source using a narrow range of wavelengths. Visual wavelengths from 400-700 nm Narrower slice of wavelengths Photometry uses filters to select wavelengths. Spectroscopy measures energy over a wide range of wavelengths. Visual spectrum UV, IR spectra Full EM spectra Spectroscopy requires instruments to get at each wavelength separately. Interferometer Measuring Energy
Luminosity of Stars • Luminosity measures how much energy is produced. • Absolute brightness L • Relative luminosity is usually based on the Sun. • Astronomers measure luminosity relative to the Sun. • LSun = 1 L • LSirius = 23 L • Stars range from 0.0001 L to 1,000,000 L .
The observed brightness is related to the energy received. The magnitude scale was originally 6 classes. Effectively logarithmic The magnitude (m) was made formal in 1856. Lower numbers brighter 6m at the limit of human vision Magnitude For 1 unit of magnitude:
Images from a telescope must fit within the pupil. Brightness proportional to the aperture squared Ratio of observed to natural No increase for extended objects from magnification. Eg. M31(> moon) Light on more rods Exclusion of other light Brightness Magnified
Point sources are smaller than one pixel (or rod). No increase in image size from magnification The ratio of brightness increase is the light grasp G. Pupil size 7 mm The limiting magnitude comes from the aperture. CCD 5 to 10 magnitudes better Point Source Magnified in meters 8” aperture is 13.3m
The observed magnitude depends on the distance to the source. Measured as apparentmagnitude. The scale is calibrated by stars within 2° of the north celestial pole. Some bright stars (app. mag.): Sun -26.7 Sirius -1.4 Alpha Centauri -0.3 Capella 0.1 Rigel 0.1 Betelgeuse 0.5 Aldebaran 0.9 These are all brighter than first magnitude (m = 1.0) Apparent Magnitude
Brightness falls off as the square of the distance d. Absolute magnitudeM recalculates the brightness as if the object was 10 pc away. 1 pc = 3 x 10¹⁶ m = 3.26 ly The absolute magnitude can be corrected for interstellar absorption AD. Distance Correction AD = 0.002 m/pc in galactic plane
Distance is important to determine actual brightness. Example: 2 identical stars A is 7 pc, B is 70 pc from Earth The apparent brightness of B is 1/100 that of A The magnitude of B is 5 larger. Some bright stars (abs. mag.): Sun 4.8 Sirius 1.4 Alpha Centauri 4.1 Capella 0.4 Rigel -7.1 Betelgeuse -5.6 Aldebaran -0.3 These are quite different than their apparent magnitudes. Absolute Magnitude
Photographic images used the width of an image to determine intensity. Calibrate with known stars Fit to curve CCDs can directly integrate the photoelectrons to get the intensity. Sum pixels covered by image Subtract intensity of nearby dark sky Data is corrected for reddening due to magnitude and zenith angle. Imaging
Radius: R = 7 105 km = 109 RE Mass : M = 2 1030 kg M = 333,000 ME Density: r = 1.4 g/cm3 (water is 1.0 g/cm3, Earth is 5.6 g/cm3) Composition: Mostly H and He Temperature: Surface is 5,770 K Core is 15,600,000 K Power: 4 1026 W Solar Facts
Particle equilibrium in a star is dominated by ionized hydrogen. Equilibrium is a balance of chemical potentials. Hydrogen Ionization ep = p2/2m n = 3 n = 2 n = 1
The masses in H are related. Small amount en for degeneracy Protons and electrons each have half spin, gs = 2. H has multiple states. The concentration relation is the Saha equation. Absorption lines Saha Equation
The types of spectra were originally classified only by hydrogen absorption, labeled A, B, C, …, P. Understanding other elements’ lines allowed the spectra to be ordered by temperature. O, B, A, F, G, K, M Oh, Be A Fine Guy/Girl, Kiss Me Our Brother Andy Found Green Killer Martians. Type Temperature O 35,000 K B 20,000 K A 10,000 K F 7,000 K G 6,000 K K 4,000 K M 3,000 K Spectral Types
Some bright stars (class): Sun G2 Sirius A1 Alpha Centauri G2 Capella G8 Rigel B8 Betelgeuse M1 Aldebaran K5 Temperature and luminosity are not the same thing. Detailed measurements of spectra permit detailed classes. Each type is split into 10 classes from 0 (hot) to 9 (cool). Spectral Classes
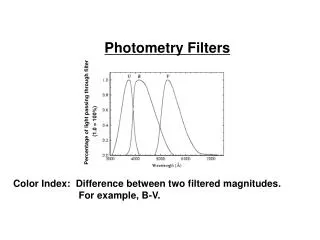
Filters • Filters are used to select a restricted bandwidth. • Wide: Dl ~ 100 nm • Intermediate: Dl ~ 10 nm • Narrow: Dl < 1 nm • A standard set of optical filters dates to the 1950’s • U (ultraviolet – violet): lp = 365 nm, Dl = 70 nm • B (photographic): lp = 440 nm, Dl = 100 nm • V (visual): lp = 550 nm, Dl = 90 nm
Other filter sets are based on a specific telescope. HST: 336, 439, 450, 555, 675, 814 nm SDSS: 358, 490, 626, 767, 907 nm The standard intermediate filter set is by Strömgren. u, b, v, y, b bw: lp =486 nm, Dl=15 nm CCDs have are good in IR, so filter sets have moved into IR as well. U, B, V, R, I, Z, J, H, K, L, M. Example M : lp = 4750 nm, Dl = 460 nm Filter Sets
The Planck formula at relates the intensity to the temperature. Approximate for T < 104 K Two magnitude measurements at different temperatures can determine the temperature. Standard with B and V filters Good from 4,000 to 10,000 K Color Index
The luminosity of a star should be related to the temperature. Blackbody formula Depends on radius Some bright stars: Sun G2 4.8 Sirius A1 1.4 Alpha Centauri G2 4.1 Capella G8 0.4 Rigel B8 -7.1 Betelgeuse M1 -5.6 Aldebaran K5 -0.3 Stellar Relations
Most stars show a relationship between temperature and luminosity. Absolute magnitude can replace luminosity. Spectral type/class can replace temperature. Luminosity vs. Temperature Sun
The chart of the stars’ luminosity vs. temperature is called the Hertzsprung-Russell diagram. This is the H-R diagram for hundreds of nearby stars. Temperature decreases to the right Hertzsprung-Russell Diagram
Main Sequence • Most stars are on a line called the mainsequence. • The size is related to temperature and luminosity: • hot = large radius • medium = medium radius • cool = small radius Sirius 1 solar radius
The color indexes can be measured for other pairs of filters. The U-B measurement brackets the Balmer line at 364 nm. Opaque at shorter wavelength This creates a discontinuity in energy measurement. Greatest at type A Drop off for B and G Balmer Jump Michael Richmond, RIT
Photometric Comparison • Stellar classification is aided by different response curves.
Bolometric magnitude measures the total energy emitted at all wavelengths. Modeled from blackbody Standard filter V Zero for main sequence stars at 6500 K Luminosity is directly related to absolute bolometric magnitude. Flux to apparent bolometric magnitude Bolometric Magnitude