Download
1 / 23
280 likes | 489 Views
Photometry and Spectroscopy. Astronomy 315 Professor Lee Carkner Lecture 7. Quiz #1. Next Monday (March 26) Covers lectures 1-9 About 16 multiple choice (~50% weight) About 4 short answer/problems (~50% weight) Equations and constants provided But unlabeled

E N D
Photometry and Spectroscopy Astronomy 315 Professor Lee Carkner Lecture 7
Quiz #1 • Next Monday (March 26) • Covers lectures 1-9 • About 16 multiple choice (~50% weight) • About 4 short answer/problems (~50% weight) • Equations and constants provided • But unlabeled • You must bring pencil and calculator! • No cell phones/PDAs • Observing list 1 due this Friday
Studying for Quiz #1 • Study • lectures • exercises • homework • readings • Can you: • Identify the key concepts of the class? • Write a paragraph explaining key concepts? • Solve math problems from exercises and book without help? • Study guide posted on web page
Studying Stars • Stars are too small to see structure • Spectra are studied through spectroscopy
Spectroscopy • If we take a spectrum of a star, what does it look like? • What do the lines and their strength tell us? • Strength of line depends on: • The temperature being such that the transitions can occur
Spectral Signatures • An atoms electron’s can be in a number of states from 1 (the ground state) to removed from the atom completely • At higher temperature they are in higher states • Ionized atoms are represented with roman numerals (e.g. Ca II, calcium with 2 electrons missing)
Spectral Lines in Stars • Most stars have very similar compositions • The spectrum we take only covers a certain energy range • Three reasons: • Temperature so high that electrons only produce higher energy transitions
The Balmer Series • All stars are made primarily of hydrogen, but many stars have weak H lines • In what stars do we see Balmer lines? • Not in cool stars (electrons all in ground state) • Only in medium hot stars are the Balmer lines strong
Spectral Types • The spectral types are (from high to low temperature): • Each spectral type is divided into 10 sub classes 0 - 9 (from high to low T)
Spectral Typing • Spectral type gives us temperature • O and B stars T ~ • A and F stars T ~ • G, K and M stars T ~ • Spectral typing is accurate to about 2-3 subcategories or a few hundred degrees
The Spectral Types • Stars were first classified by strength of the H Balmer line • Eventually it was determined that this sequence did not reveal anything of astrophysical significance
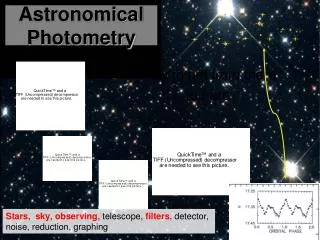
Photometry • We want to get an accurate quantitative measure of brightness • Our system is composed of two things:
Magnitude • The magnitude scales is logarithmic and is related to the flux by: m2 – m1 = 2.5 log10 (f1/f2) • where the flux is defined as the amount of energy received from the star per unit area per unit time (watts/m2/s)
Notes on Magnitude • Magnitude scale runs backwards • Scale is semi logarithmic • A star that is n less magnitudes has 2.5n times the flux • 5 magnitude difference is factor of 100 difference in flux • Magnitude is sometimes indicated with an “m”
Magnitudes of Selected Objects • Sun: • Moon: • Venus: • Sirius: • Faintest star you can see: • Faintest star with small telescope: • Large telescope and CCD camera: • Hubble Space Telescope:
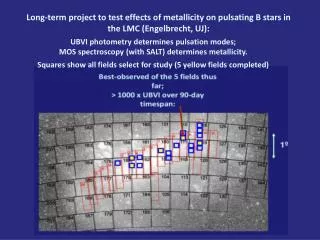
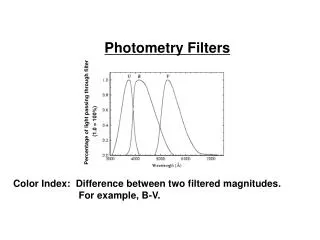
Filters • Use a set of standard filters, such as the UBVRI scale • e.g. V = 500-600 nm, B = 400-480 nm • We report the magnitudes with the letter of the filter
Color Index • The color index gives an estimate of the temperature • Example B-V: • Negative B-V means smaller B magnitude, which means more blue light, indicating a hot star
Star Names • Only the brightest stars in the sky have proper names • e.g., Rigil Kentaurus from Rijl al-Qanturis meaning “Foot of the Centaur” • Bright stars also have a Bayer designation • Alpha (a) Centauri, Beta (b) Centauri, Gamma (g) Centauri, etc.
Next Time • Read Chapter 17.1-17.6