Download
1 / 25
250 likes | 379 Views
Five ecologically d istinct functional groups Three trophic levels. Continuous Plankton Recorder. http://www.sahfos.ac.uk/. A diatom, showing the typical results for diatoms and copepods. A dinoflagellate , showing the typical results for dinoflagellates and zooplankton.

E N D
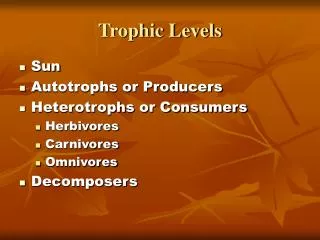
Five ecologically distinct functional groups Three trophic levels
A diatom, showing the typical results for diatoms and copepods A dinoflagellate, showing the typical results for dinoflagellates and zooplankton
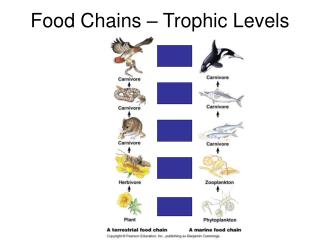
Marine food-web succession: copepods and diatoms first, followed by primary and secondary consumers
Little shift in mean seasonal peak – peak during turnover in water column responding to photoperiod cues
Advance in mean seasonal peak – peak after turnover in water column responding to temperature cues
Peak abundance is: Earlier Later Regression of T on year: = 0.9deg C over 43 years
Producers Consumers
Climate Envelope Modelling Approach: Observed effects on (distribution, abundance) and growth of temperature and dissolved O2 2. Projected changes in temperature and dissolved O2 under SRES A2 Scenario.
Cod Haddock
Chinook and RBT: 24 C thermal tolerance • Bull trout: 14.4 C thermal tolerance • 95th percentile of frequency distribution • on a weekly scale John Day River system Hobo temperature loggers
Max stream temperature = fn (max air temp + solar radiation)
AIR TEMPERATUREPROJECTIONS A1B emissions scenario
Historic (1993-2009) Projection (2070-2099) Chinook and RBT: 24 C thermal tolerance Bull trout: 14.4 C thermal tolerance
2070 -2099 vs 1993 - 2009 MS – main stems TRB – tributaries ALL - combined L – loss by reach length V- loss by reach volume