Download
1 / 32
320 likes | 461 Views
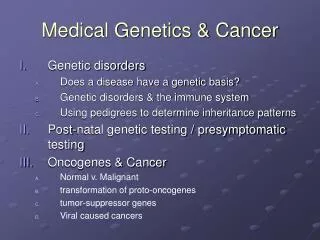
Medical Genetics & Cancer. Genetic disorders Does a disease have a genetic basis? Genetic disorders & the immune system Using pedigrees to determine inheritance patterns Post-natal genetic testing / presymptomatic testing Oncogenes & Cancer Normal v. Malignant

E N D
Medical Genetics & Cancer • Genetic disorders • Does a disease have a genetic basis? • Genetic disorders & the immune system • Using pedigrees to determine inheritance patterns • Post-natal genetic testing / presymptomatic testing • Oncogenes & Cancer • Normal v. Malignant • transformation of proto-oncogenes • tumor-suppressor genes • Viral caused cancers
I. Genetic disorders • Approximately 4,000 genetic diseases that affect people have been identified, most likely a significant underestimate • One of the most difficult problems facing scientists is to learn how genes contribute to disease that have a complex pattern of inheritance involving several genes!
A. Determining whether or not a disease has a genetic basis: • When an individual exhibits a disease, the disorder is more likely to occur in genetic relatives than in the general population • Identical twins share the disease more often than non-identical twins • The disease does not spread to individuals sharing similar environmental situations • Different populations tend to have different frequencies of the disease • The disease tends to develop at a characteristic age (age of onset) • The human disorder may resemble a disorder that is already known to have a genetic basis in an animal. • A correlation is observed between a disease and a mutant human gene or a chromosomal disorder.
Albinism Atraxia telangiectasia Bloom syndrome Cystic fibrosis Fanconi anemia Galactosemia Phenylketonuria Sicle cell anemia Thalassemia Xeroderma pigmentosum Tay-sachs disease Muscular dystrophy Achondroplasia Brachydactyly Camptodactyly Crouzon syndrome Ehlers-Danlos syndrome Familial hyperocholesterolemia Adult polycystic kidney disease Huntington disease Hypercalcemia Marfan syndrome Nail-patella syndrome porphyria Characterized genetic disorders
B. Genetic disorders & the immune system • X-linked agammaglobulinemia (XLA) • Severe combined immunodeficiency (SCID) • X-linked Hyper IgM Syndrome
C. Using pedigrees to determine inheritance patterns of disease • When a disorder is caused by a mutation in a single gene, the inheritance pattern can be deduced by analyzing pedigrees, and data can be pooled from many large pedigrees • When we do not know the actual genetic defect underlying the disease or if great number of diverse mutations in the disease gene exist, one can still consult families in risk, provided we know the approximate chromosomal localization of the causal genetic defect. • We can simply use a genetic marker occurring at that place of the genome, type the healthy as well as afflicted persons in the family and try to deduce, which allele of the polymorphism is linked to the disease allele and predict thus the genotype in the disease locus and evaluate the risk in prenatal or pre-symptomatic or to identify carriers. • Disadvantage of the indirect method is the need of complete family, with already afflicted members. • Another complication is that in each family, the disease will be in general linked to a different allele of the polymorphism (it is only linkage, not cause of the disease). Some families will be thus uninformative for a given polymorphism and will have to be screened for more polymorphic loci till we find an informative one.
Lod score • Genetic markers can be linked to genes associated with disorders • “Log of odds” – method to obtain a more reliable linkage estimate from single matings • the most commonly used statistic, based on the direct comparison of probability of null hypothesis, stating that there is no linkage (recombination fraction 1/2), with the alternative hypothesis, claiming there is linkage with a certain recombination fraction θ. • Measures the log10 of the likelihood that a particular set of linkage data would be obtained if two genes are linked, divided by the likelihood that the same data would be obtained if the genes were unlinked. • Assess the probability that a pedigree involving 2 traits reflects linkage
Using Lod scores • Lod scores from different families can be added, giving a cumulative set of data • evaluate the pedigrees for the trait for two hypotheses (1) that the loci are linked and a specific distance apart and (2) the loci are not linked. • Compare the two results in a particular way, and get the likelihood that the first hypothesis is right. • If Lod is greater than 0, data are consistent with linkage, negative lod scores indicate independent assortment. • Lod scores of 3.0 or higher cause general acceptance of linkage model; this value means that linkage (at the particular distance tested) is 1,000 times more likely than independent assortment
Probability of obtaining results under independent assortment: 0.25 x 0.25 x 0.25 x 0.25 x 0.25 x 0.25 x B Probability of obtaining results under linkage: 0.4 x 0.1 x 0.4 x 0.4 x 0.1 x 0.4 x B ratio = 1.08 Lod score = 0.03
The RF is most likely between 30 & 40%, however there is not sufficient support for linkage.
NF = autosomal dominant + = genetic marker Linked? Not linked? Suppose they are linked? Expected proportions of genotypes The probability of obtaining the results under independent assortment: (RF = 0.5) 0.25 x 0.25 x 0.25 x 0.25 x 0.25 x B = 9.76 x 10⁻⁴ x B For an RF of 0.2, the probability is: 0.4 x 0.1 x 0.4 x 0.4 x 0.4 x B =0.00256 x B The ratio of the two = 2.62, hence the hypothesis of RF 0.2 is 2.62x’s more likely, the Lod score is 0.4
II. Post-natal genetic testing / presymptomatic testing • Newborn screening • Heterozygote screening • Presymptomatic testing • Biochemical testing – metabolite screen • Molecular testing
Molecular testing • PCR • Allows for mutation screening • Cystic Fibrosis • Recognize large deletions/duplications • Identify CpG expansions (fragile X) • Restriction Digest (if mutation affects restriction site) • DNA sequencing • DNA chip (recognize specific mutations)
Cystic Fibrosis - #1 genetic disorder in US • nearly always fatal by the fourth decade of life • caused by a defective gene, which codes for a sodium and chloride (salt) transporter found on the surface of the epithelial cells that line the lungs and other organs • DNA sequencing used to detect most common mutations • screening for the 33 most common mutations detects ~90% of the mutant alleles in a population of N. European ancestry
III. Oncogenes & Cancer Cancer = Normal cell begins to grow in an uncontrolled and invasive manner. Oncogene = gene that promotes cancer. Oncoprotein = continuously expressed protein product of an oncogene. • Transformation – conversion of a normal cell into a malignant cell (neoplastic). • Immortalization • Metastasis
Normal v. Malignant cellsNormal Cell culture features: • 1) Anchorage dependence • 2) Serum dependence • 3) Density – dependent inhibition • 4) Cytoskeletal organization
1. transformation • Immortalization and aneuploidy: survival and continuous growth beyond normal limits involves changes at the telomere that frequently result in major chromosomal rearrangements. • Partial or complete loss of growth factor dependence:growth on less rich serum, or at lower initial cell density. • Loss of contact inhibition: overgrowth of monolayers. • Loss of anchorage requirement: growth on soft agar or in suspension.
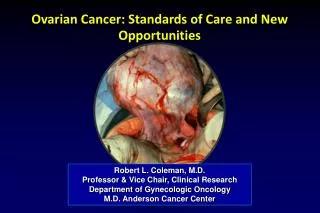
Ovarian tumor: Damaged cells go on and divide uncontrollably! Cell cycle checkpoints not working…
cyclin combines w/ Cdk molecules to produce F’s at the the checkpoints. These factors then phosphorylate other proteins… Molecular mechanisms of cell cycle control
“Accelerator” – gas pedal controlled by Cdk2/cyclinA-Rb
2. Cancer is a gene disorder • Usually multiple genetic changes needed to create cancer • Carcinogens – mutagens that increase the frequency of cell transformation • Two classes of genes in which mutations cause transformation 1) proto-oncogenes 2)tumorsupressors STUCK ACCELORATERand/orBRAKE FAILURE
B. transformation of proto-oncogenes • proto-oncogenes: normal genes found in an animal’s genome • Proto-oncogenes code for cellular proteins that relay signals, stimulating growth; these cellular proteins are responding to signals from other cells. • Stuck accelerator (stimulation uncontrolled)
Alterations of proto-oncogenes: • proto-oncogene can insert itself into new places in genome • can be amplified, increasing the # of copies of the gene • point mutation can occur in the proto-oncogene, transforming them into oncogenes
Results of altered proto-oncogenes“stuck accelerator” • overproduction of growth factors; • flooding of the cell with replication signals; protein kinases (enzymes that add phosphate groups to target proteins) • uncontrolled stimulation in the intermediary pathways; and/or • unrestrained cell growth driven by elevated levels of transcription factors.
Example: ras genes • Ras protein forms a complex that is triggers signaling system which activates cell proliferation, Responds to growth factors • Mutation of ras causes over-activity • ras wild type: GGC GCC GGC GGT GTG GGC • Mutant: GGC GCC GTC GGT GTG GGC • Results in Val instead of Gly, the Ras oncoprotein can’t hydrolyze GTP to GDP, so it remains in the active Ras-GTP state!
C. tumor-suppressor genes Brake failure (inhibition fails) • Tumor suppressor genes - genes that encode for proteins that normally prevent uncontrolled cell growth • Trigger apoptosis • e.g. BRCA1, NF1, p16, p53, WT1, RB • i.e. p53 Prevents transcription of genes required for passage through G1 checkpoint • Uncontrolled growth is not suppressed because inhibitory activity is lost when these genes are altered
Knudson’s 2 hit hypothesis • Example: Retinoblastoma • Two genetic events affect the two normal copies of the tumor supressor gene RB1 First hit: an RB1 mutation (RBx) on chromosome 13q14 results in a heterozygous retinoblast. During mitosis, a non-disjunction event occurs, resulting in a daughter cell with only a single copy of chromosome 13 containing RBx. (d) Chromosome 13 reduplicates, resulting in a cell homozygous for the RBx mutation. After this ‘second hit’ the cell has lost RB protein function and has malignant potential.
D. Tumor viruses • ~ 15% of cancers are caused by viruses • Virus throws a regulatory switch that changes the growth properties of the cell • Oncogenic retroviruses, have an oncogene that gives them the ability to transform the host
Tumor-virus pathway: 1. Virus infects host cell. 2. Viral DNA is integrated (randomly) in host chromosome. 3. Viral genes are transcribed and translated constitutively. 4. Viral oncogene products (oncoproteins) interfere with normal controls on cell growth and proliferation.
Multi-step model for colon cancer: • loss of tumor-suppressor gene APC (polyp develops) • activation of ras • loss of tumor suppressor gene DCC (tumor malignant) • loss of tumor suppressor gene p53 • Additional mutations & then metastasis