Download
1 / 33
330 likes | 454 Views
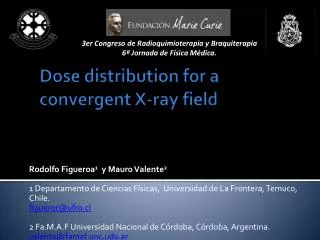
R.G. Figueroa 1 , M. Valente 2 1 Departamento de Cs. Físicas, Universidad de La Frontera, Temuco Chile 2 Universidad Nacional de Córdoba , Córdoba, Argentina , E-mail: figueror@ufro.cl. Dose Calculation Distribution for in-vivo X-ray Fluorescence Scanning. Outlines. Motivation

E N D
R.G. Figueroa1, M. Valente 2 1 Departamento de Cs. Físicas, Universidad de La Frontera, Temuco Chile 2 Universidad Nacional de Córdoba, Córdoba, Argentina, E-mail: figueror@ufro.cl. Dose Calculation Distribution for in-vivo X-ray Fluorescence Scanning
Outlines • Motivation • Materials and Methods • Results • Conclusions
Motivation • OUR GOAL: To assess the in-depth dose distribution within human-like phantom for in-vivo scanning XRF applications.
Motivation • The spatial distribution and concentration of chemical elements in different organs and bone, might be an indicator of certain diseases or be out of the tolerable levels, therefore : • The knowledge of the concentration of elements and their spatial distribution may provide important information regarding the health of an individual. • In vivo X-ray fluorescence analysis has been used since 1976, which allows the detection of elements present in the body, that could be the cause of certain diseases.
Some effects on human health • High levels of copper (Cu) have shown to be directly correlated with different cancer diseases. Elevated copper levels have been found in malignant cells, in concentrations that range from 1.5 to 3 times higher, compared to their normal values. • Lead (Pb) is one of the most studied elements. An increased level of Pb can cause different diseases in human health • A high concentration of Strontiuminterferes with the mechanism of calcification of bone matrix, among other effects
Some effects on human health • The serum iron (Fe) levels in the blood can also determine severity of thalassemia. • Mercury (Hg) is a toxic and nonessential element for humans, which can cause poisoning by concentration. • Zinc (Zn) is an essential mineral for human growth, important for bone mineralization. Zinc compounds may be a new drug in the treatment of osteoporosis. • Calcium (Ca) and phosphorus (P) are the main mineral components of bone tissue.
DoseCalculation • In order to implement any kind of radiation therapy or diagnosis, it is mandatory to suitably perform preliminar dose delivery estimations. • In this case it is necessary to carefully establish energy deposition and radiation damage potentiality for a low energy (some tens of keV) photon beam irradiating a human-like phantom. • All interaction mechanisms have to be considered, however photoelectric and Compton effects along with elastic scattering are the most relevant ones.
Mecanismos de Interacción • Photoelectric Effect • Compton scattering • Rayleigh scattering • Pair (e--e+) production • More relevant effects: • Photoelectric • Compton • Rayleigh
L x dx N0 NL Dosimetry calculation model: suitable approximations • Irradiated material: tissue-equivalent water-equivalent (International Protocols TRS-398) • Photoelectric effect as predominant interaction mechanism. • Irradiation beam as pencil kernel (high collimated) beam • Calculation based on absorbed primary particles at thickness dx position at depth x. • Model: Lambert Law
Incident Spectrum • X-ray tube according to in-vivo scanning ubo XRF system • Collimators (from 0,1 to 2,0 mm diameter)
Mass Absorbed dose calculation • Mean (macroscopic) dose value as energy per unit mass
Absorbed dose calculation: suitable approximations • Incident spectrum represented as a sequence of piecewise continuous and weighted contributions (dE E) • Macroscopic thickness: intervals of lengths (dx x(=1mm)) • Energy tallied within x thickness of section A • Method “pencil beam”.
Geometric arrangement and irradiation set up • Collimated incident beam • Irradiated surface: plane • Irradiated material: homogeneous (water)
Geometric arrangement and irradiation set up • Incidente beam: collimated and normal • Irradiated surface: smooth • Irradiated phantom: Heterogeneous • Skin • Muscle (skeletal) • Bone (compact)
Preliminary dose estimation: Results • In-depth dose distribution for homogeneous (water-equivalent) phantom
Preliminary dose estimation: Results • In-depth dose distribution for heterogeneous (skin-muscle-bone) phantom
Materials and Methods • XRF Spectrometer • A robotic arm • Electronic & software control • Geometry • Scanning Area • XRF image acquisition • Samples
XRF Spectrometer • 1 mini X-ray tube (MXRT) • A digital pulse processor with MCA • A detector SDD (Silicon Drift Detector)
Roboticarm • A robotic arm which positions the detector and the Mini-X at 90º and 45ºfrom the horizontal (x, y) of the sample
Electronic & software control • An electronic control software for the mechanical x,y system and image processing, which allows you to select the step and acquisition time at each point.
Geometry • MTRX-sample distance is 1.3 cm , approximately • sample-SDD distance is 1.5 cm approx.
Scanning area • Each scan is defined as the area of interest shape and size of the sample • The maximum 100x100 mm2, • variable spatial resolution that can reach 0.1 mm2per pixel, according to the step and diameter collimation • The step ranges from 0.1 mm to 50 mm with a minimum of XRF spectral capture up to 1 ms per point, with 256 energy channels.
The XRF roboticsystem Firmware and Electronic Mechanical part Arm Sample Control Shifter x, y PC: Control Software Data Acquisitions Amp+ADC Detector SDD X-ray tube
Samples • Humanbones: phalanges, patella, femur, fibula and jaw • Animal: gallusgalluslegs, RatKidney • Blade-bone • Biological material equivalenttobone-tissue, includingpuresolids and standardsforcalibration.
Esamples:Humanhandimages Ca P Zn Fe Hand Skeleton images analysis (optical), top left, together with the corresponding XRF elemetal images of the Ca, P, Fe, Zn detected in the skeleton of a human hand.
Example: hand Integrated XRF spectrum of the human hand skeleton, here shown the presence of 14 elements.
Collimatorsizeeffectsample: phalangealjoint 1.50 mm 0.75 mm 1.00 mm 0.50 mm collimation effects in the XRF image obtained in a phalanx bone, calcium element
Rat kidney Visible and XRF+ Background images
Rat kidney As Cl Cu K Ti Fe
Conclusions • Ha sido posible determinar la dosis en un caso particular a que estaría sometido un paciente que experimente un analisis XRF en vivo mediante barrido . • The system….
yourattention Thanksfor
Acknowledgements • Thanks to the National Fund for Scientific and Technological Research (FONDECYT)of Chile, which has funded this work through Project 1080306 and Morphology Unit, Department of Basic Sciences, University of La Frontera for providing bone samples used in this work. • And……