Download
1 / 20
200 likes | 226 Views
Explore the evolution of the UK population from 1871 to 2015, including fertility rates, life expectancy, migration patterns, ethnic composition, and future projections.

E N D
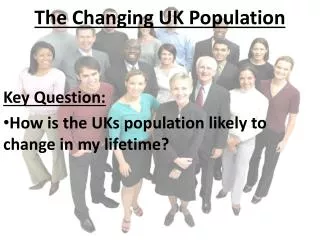
The Changing Structure of the UK Population Andrew Nash, Population Statistics Division Office for National Statistics (Note: all data are from ONS unless otherwise indicated)
UK population, 1871 to 2015 Note: most of discontinuity in WW1 and WW2 is because of troops posted overseas. Ireland achieved independence in 1922.
Ethnic composition of population by age,England and Wales, 2001 Census
Ethnic composition of population by age, England and Wales, 2011 Census
Long-term immigrants to UK, 2015, by previous country of residence
When will the UK population reach 70 million? • 2025 • 2030 • 2035
UK old age dependency ratio (per 1,000 people of working age)
UK population projections by ethnic group Source: Wohland P, Burkitt M, Norman P, Rees P, Boden P and Durham H, ETHPOP Database, ESRC Follow on Fund "Ethnic group population trends". www.ethpop.org. Date of extraction 19.04.2017.
Projected growth, countries of the UK, 2014 to 2024 (principal projection)
Projected growth 2014 to 2024: local authority gainers and losers
Selected pending population publications • 27 Apr 2017: Mid-2016 estimates, Scotland • Jun 2017: Mid-2016 estimates for rest of UK • Oct / Nov 2017: National population projections, 2016-based (UK and countries) • 2018: Subnational population projections for England, Scotland and Northern Ireland, 2016-based Population estimates are annual; population projections are biennial except in Wales where they are triennial.
And finally . . . ONS population contact: pop.info@ons.gov.uk 01329 444661 www.ons.gov.uk Twitter: @PaulVickers_ONS Any questions / comments / suggestions? What would be useful to you?