Download
1 / 28
280 likes | 314 Views
Learn about hyperbolas, their geometric definition using distances, equations, properties, and graphing techniques. Understand horizontal and vertical transverse axes, asymptotes, vertices, foci, and central box method for drawing hyperbolas accurately.

E N D
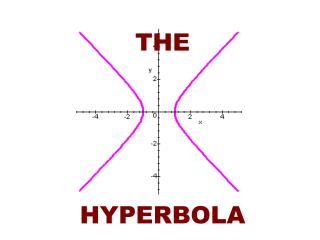
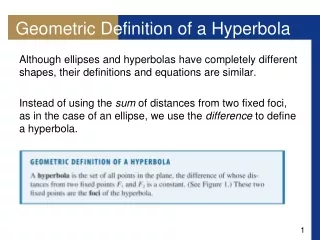
Geometric Definition of a Hyperbola • Although ellipses and hyperbolas have completely different shapes, their definitions and equations are similar. • Instead of using the sum of distances from two fixed foci, as in the case of an ellipse, we use the difference to define a hyperbola.
Geometric Definition of a Hyperbola P is on the hyperbola if |d(P, F1) – d(P, F2)| = 2a. Figure 1
Geometric Definition of a Hyperbola • This is the equation of the hyperbola. If we replace x by –x or y by –y in this equation, it remains unchanged, so the hyperbola is symmetric about both the x- and y-axes and about the origin.
Geometric Definition of a Hyperbola • The segment joining the two vertices on the separate branches is the transverse axis of the hyperbola, and the origin is called its center. • If we place the foci of the hyperbola on the y-axis rather than on the x-axis, this has the effect of reversing the roles of x and y in the derivation of the equation of the hyperbola. • This leads to a hyperbola with a vertical transverse axis.
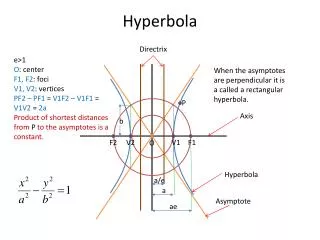
Equations and Graphs of Hyperbolas • The main properties of hyperbolas are listed in the following box.
Equations and Graphs of Hyperbolas • The asymptotes mentioned in this box are lines that the hyperbola approaches for large values of x and y. • To find the asymptotes in the first case in the box, we solve the equation for y to get
Equations and Graphs of Hyperbolas • As x gets large, a2/x2 gets closer to zero. In other words, as x , we have a2/x2 0. So for large x the value of y can be approximated as y = (b/a)x. • This shows that these lines are asymptotes of the hyperbola. Asymptotes are an essential aid for graphing a hyperbola; they help us to determine its shape. • A convenient way to find the asymptotes, for a hyperbola with horizontal transverse axis, is to first plot the points(a, 0), (–a, 0), (0, b) and (0, –b).
Steps in graphing the hyperbola Equations and Graphs of Hyperbolas • Then sketch horizontal and vertical segments through these points to construct a rectangle, as shown in Figure 2(a). We call this rectangle the central box of the hyperbola. (a) Central box Figure 2
Steps in graphing the hyperbola Equations and Graphs of Hyperbolas • The slopes of the diagonals of the central box are b/a, so by extending them, we obtain the asymptotes y = (b/a)x, as sketched in Figure 2(b). (b) Asymptotes Figure 2
Steps in graphing the hyperbola Equations and Graphs of Hyperbolas • Finally, we plot the vertices and use the asymptotes as a guide in sketching the hyperbola shown in Figure 2(c). (A similar procedure applies to graphing a hyperbola that has a vertical transverse axis.) (c) Hyperbola Figure 2
Example 1 – A Hyperbola with Horizontal Transverse Axis • A hyperbola has the equation • 9x2 – 16y2 = 144 • (a) Find the vertices, foci, and asymptotes, and sketch the graph. • (b) Draw the graph using a graphing calculator. • Solution:(a) First we divide both sides of the equation by 144 to put it into standard form:
Example 1 – Solution cont’d • Because the x2-term is positive, the hyperbola has a horizontal transverse axis; its vertices and foci are on the x-axis. Since a2 = 16 and b2 = 9, we get a = 4, b = 3, and c = = 5. • Thus we have • Vertices (4, 0) • Foci (5, 0) • Asymptotes y = x
Example 1 – Solution cont’d • After sketching the central box and asymptotes, we complete the sketch of the hyperbola as in Figure 3(a). 9x2 – 16y2 = 144 Figure 3(a)
Example 1 – Solution cont’d • (b) To draw the graph using a graphing calculator, we need to solve for y. • 9x2 – 16y2 = 144 • –16y2 = – 9x2 + 144y2 • y2 = • = Subtract 9x2 Divide by –16 and factor 9 Take square roots
Example 1 – Solution cont’d • To obtain the graph of the hyperbola, we graph the functions • and • as shown in Figure 3(b). 9x2 – 16y2 = 144 Figure 3(b)
Example 2 – A Hyperbola with Vertical Transverse Axis • Find the vertices, foci, and asymptotes of the hyperbola, and sketch its graph. • x2 – 9y2 + 9 = 0 • Solution:We begin by writing the equation in the standard form for a hyperbola. • x2 – 9y2 = –9 • y2 – = 1 Divide by –9
Example 2 – Solution cont’d • Because the y2-term is positive, the hyperbola has a vertical transverse axis; its foci and vertices are on the y-axis. Since a2 = 1 and b2 = 9, we get a = 1, b = 3, andc = = . • Thus we have • Vertices (0, 1) • Foci (0, ) • Asymptotes y = x
Example 2 – Solution cont’d • We sketch the central box and asymptotes, then complete the graph, as shown in Figure 4(a). We can also draw the graph using a graphing calculator, as shown in Figure 4(b). (a) (b) x2 – 9y2 + 9 = 0 Figure 4
Example 3 – Finding the Equation of a Hyperbola from Its Vertices and Foci • Find the equation of the hyperbola with vertices (3, 0) and (4, 0) foci . Sketch the graph. • Solution:Since the vertices are on the x-axis, the hyperbola has a horizontal transverse axis. Its equation is of the form • We have a = 3 and c = 4. To find b, we use the relation a2 + b2 = c2: • 32 + b2 = 42
Example 3 – Solution cont’d • b2 = 42 – 32 = 7 • b = • Thus the equation of the hyperbola is • The graph is shown in Figure 5. Figure 5
Example 4 – Finding the Equation of a Hyperbola from Its Vertices and Asymptotes • Find the equation and the foci of the hyperbola with vertices (0, 2) and asymptotes y = 2x. Sketch the graph. • Solution:Since the vertices are on the y-axis, the hyperbola has a vertical transverse axis with a = 2. From the asymptote equation we see that a/b = 2. Since a = 2, we get 2/b = 2, so b = 1. • Thus the equation of the hyperbola is • – x2 = 1
Example 4 – Solution cont’d • To find the foci, we calculate • c2 = a2 + b2 • = 22 + 12 • = 5 • so c = . Thus the foci are (0, ). The graph is shown in Figure 6. Figure 6
Equations and Graphs of Hyperbolas • Like parabolas and ellipses, hyperbolas have an interesting reflection property. Light aimed at one focus of a hyperbolic mirror is reflected toward the other focus, as shown in Figure 7. Reflection property of hyperbolas Figure 7
Equations and Graphs of Hyperbolas • This property is used in the construction of Cassegrain-type telescopes. A hyperbolic mirror is placed in the telescope tube so that light reflected from the primary parabolic reflector is aimed at one focus of the hyperbolic mirror. • The light is then refocused at a more accessible point below the primary reflector (Figure 8). Cassegrain-type telescope Figure 8
Equations and Graphs of Hyperbolas • The LORAN (LOng RAnge Navigation) system was used until the early 1990s; it has now been superseded by the GPS system. • In the LORAN system, hyperbolas are used onboard a ship to determine its location. In Figure 9, radio stations at A and B transmit signals simultaneously for reception by the ship at P. LORAN system for finding the location of a ship Figure 9
Equations and Graphs of Hyperbolas • The onboard computer converts the time difference in reception of these signals into a distance differenced(P, A) – d(P, B). • From the definition of a hyperbola this locates the ship on one branch of a hyperbola with foci at A and B (sketched in black in the figure). • The same procedure is carried out with two other radio stations at C and D, and this locates the ship on a second hyperbola (shown in red in the figure).
Equations and Graphs of Hyperbolas • (In practice, only three stations are needed because one station can be used as a focus for both hyperbolas.) The coordinates of the intersection point of these two hyperbolas, which can be calculated precisely by the computer, give the location of P.