Download

1 / 28
280 likes | 346 Views
This sample problem walks through the process of analyzing experimental data in order to determine the relationship between two variables, A and B. It demonstrates how to plot the data, identify the shape of the line, and find the equation of the best fit line. The data suggests that A is inversely proportional to the square of B.

E N D
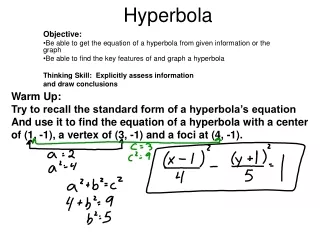
Analyzing Experimental Data • Hyperbola • (A as a function of B) Created for CVCA Physics by Dick Heckathorn 30 August 2K+4 Sample Problem page 24 Hyperbola
A. Getting Ready • 1. Mode Setting • Normal, Float, Degree, Func, Connected, Sequential, Full Screen • 2. Exit: “2nd” “Quit”
B. Storing Data 1. “Stat”, “Edit” 2. Place cursor over an empty heading at the top. 3. Label it ‘A’ • Repeat by labeling another blank heading ‘B’
B. Storing Data 5. Input data into appropriate column. 6. ‘A’ 36 9.0 4.0 2.3 1.4 ‘B’ 2.0 4.0 6.0 8.0 10 [‘A’ is a function of ‘B’]
C. Clear Previous Graphs 1. “Y=” 2. clear any equations 3. “2nd”, “stat plot” 4. Enter “4” - PlotsOff 5. “Enter”
D. Preparing to Plot 1. “2nd”, “Stat Plot” 2. With cursor at 1, “Enter” 3. Set the following: a. to on b. Type: select 1st graph c. Xlist to ‘B’, -> “2nd” “List” ‘B’ d. Ylist to ‘A’, -> “2nd” “List” ‘A’ d. Mark: select square
E. Graphing The Data 1. “Zoom”, “9: ZoomStat” (This allows all points to be plotted using all of the screen.) 2. “Windows” a. Set Xmin= and Ymin= to zero b. “Graph” (This shows all of 1st quadrant)
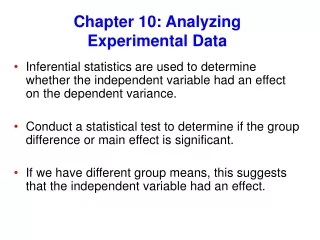
F. Analysis Shape of line is? Which indicates?
G. Analysis Explained 1. Shape of line is a hyperbola pulled away from y-axis. (Must see all of 1st quadrant.) 2. Since it is a hyperbola, an inverse power is implicated. 3. This suggests that one plots ‘A’ to some inverse power of ‘B’. 4. Next plot ‘A’ vs “1/B”.
G. Analysis of Hyperbola 1 To plot ‘A’ vs ‘1/B’ using the calculator 1. Place cursor over an empty heading at the top of a list. • Label it ‘BINV’ • Put cursor over heading and type: “1/”, “2nd” “List”, Select ‘B’ 4. The data should fill in.
G. Analysis of Hyperbola 2 1. “2nd”, “Stat Plot” 2. With cursor at 1, “Enter” 3. Set the following: a. on b. Type: -> select 1st graph c. Xlist: ‘1/B’-select from (2nd list) d Ylist to ‘A’ -select from (2nd list) d. Mark: select square
G. Analysis of Hyperbola 3 1. “Zoom”, “9: ZoomStat” (This allows all points to be plotted using all of the screen.) 2. “Windows” a. Set Xmin= and Ymin= to zero “Graph” (This shows all of 1st quadrant)
G. Analysis of Hyperbola 4 Shape of line is? Which indicates?
G. Analysis of Parabola 1 1. Shape of line is an upright parabola. (Must see all of 1st quadrant.) 2. Since it is a parabola, a greater power of ‘n’ is implicated. 3. This suggests that one plots ‘1/Bn’ to a higher value (let ‘n’ now equal 2) 4. So let’s plot ‘A’ vs ‘1/B2’
G. Analysis of Hyperbola 1 To plot ‘A’ vs ‘1/B2’ : 1. Place cursor over an empty heading at the top of a list. • Label it ‘BINVSQ’ • Put cursor over heading and type: “1/”, “2nd” “List”, Select ‘BINV’ 4. The data should fill in.
G. Analysis of Parabola 3 1. “2nd”, “Stat Plot” 2. With cursor at 1, “Enter” 3. Set the following: a. on b. Type: select 1st graph c. Xlist to ‘BINVSQ’, Ylist to ‘A’ d. Mark: select square
G. Analysis of Parabola 4 1. “Zoom”, “9: ZoomStat” (This allows all points to be plotted using all of the screen.) 2. “Windows” a. Set Xmin= and Ymin= to zero b. “Graph” (This shows all of 1st quadrant)
G. Further Analysis Now that we have found a straight line that will fit the data points, we can proceed to find its equation.
H. Finding the Equation 1. “Stat”, “Calc” “4:LinReg(ax+b) 2. Enter ‘BINVSQ’, ‘A’ (for x and then y variable) 3. “Enter” 4. On screen we see: a. LinReg y=ax+b a =___, b =___, r =___ a = slope, b = y-intercept
H. The Equation is: Using y = mx+b concept where the calculator uses y = ax+b substitute in the value for ‘a’ and ‘b’ and one gets: Since b = 0, we can say that A is directly proportional to B with a proportionality constant equal to the value of ‘m’.
I. Plotting Line of Best Fit 1. “Y=”, “VARS”, “4:Statistics...”, “EQ”, “1:RegEq”, “Graph” 2. And there you have it, the equation of the best fit line for the data points plotted. 3. In real life data gathering, all the points will not fall on the line due to normal measurement error.
J. The Equation Did you get y = _____ x-2 ? This would suggest A = 10 1/B2
J. A Thought That’s all there is to it. If the data yields a straight line, analyze it to find the equation. If it is a hyperbola or a parabola, then you must make additional plots until you get a straight line.
K. A Final Thought What do we say is the relationship between A and B? We say the relationship is: ‘A’ is inversely proportional to the square of ‘B’.
L. A Final, Final Thought At this time, write out a brief summary using bullet points for what you did. Do not go on unless you have completed the above.
M. A Shortcut 1. Using original data plot ‘A’ as a function of ‘B’. 2. “Stat”, “Calc”, “B:PwrReg”, 3. “2nd”, “List”, “B”, “2nd”, “List”, “A,”, “Enter”
M. A Shortcut -2- 5. Substitute: y=a*xb value of ‘a’ = 145.1 value of ‘b’ = -2.005 6. How does this equation compare to that found earlier?